| Author |
 Topic Topic  |
|
|
ihab17
    
Italy
240 Posts |
 Posted - 01/09/2021 : 06:37:13 Posted - 01/09/2021 : 06:37:13


|
Hello
With COVID 19, and my family members all at home during the lockdown, I couldn't keep working from home (apartment at floor +2), so I moved to the garage (floor -1). After almost 10 months, I decided to get a Geiger counter, so first I got GMC-500+ from Amazon and started collecting readings from the garage, but all readings where in the normal range. I returned the GMC-500+ because I didn't know it couldn't detect Alpha particles, so I got my new GMC-600+ from eBay, directly from GQ, and it arrived yesterday. And wow! Just as soon as I registered my device, connected it to my Wi-Fi in the garage, I got medium/high readings. At first I though I had done something wrong, but there isn't something I could mess with the counter that would increase the counts so much. I even decided to perform a INIT-SETUP reset but that didn't change anything
I live near Rome/Italy in a volcanic area and these are my readings so far
h**p://www.gmcmap.com/historyData.asp?Param_ID=41517567667
Based on those readings, do I need to contact the authorities for a Radon check in my garage? Are these numbers high enough to trigger an alert? Heck I worked for 10 months in the garage without any type of protection! |
|
| Reply #1
Damien68
    
France
780 Posts |
 Posted - 01/09/2021 : 08:08:58 Posted - 01/09/2021 : 08:08:58


|
it's starting to be high (around 0.42uS/h),
in principle it is necessary to ventilate regularly, but in (floor -1) it may be a problem.
Personally I will go up back my office in your apartment but without fears.
there aren't so many adequate protections, about what do you think? gas mask and lead armor? |
Mastery is acquired by studying, with it everything becomes simple |
Edited by - Damien68 on 01/09/2021 08:34:25 |
 |
|
| Reply #2
ihab17
    
Italy
240 Posts |
 Posted - 01/09/2021 : 09:16:55 Posted - 01/09/2021 : 09:16:55


|
quote:
Originally posted by Damien68
it's starting to be high (around 0.42uS/h)...
Hello Damien
I already packed and returned back to my apartment, and I hope I'd be able to work with customers in this smart working period, without hearing screaming and baby noises all the time 
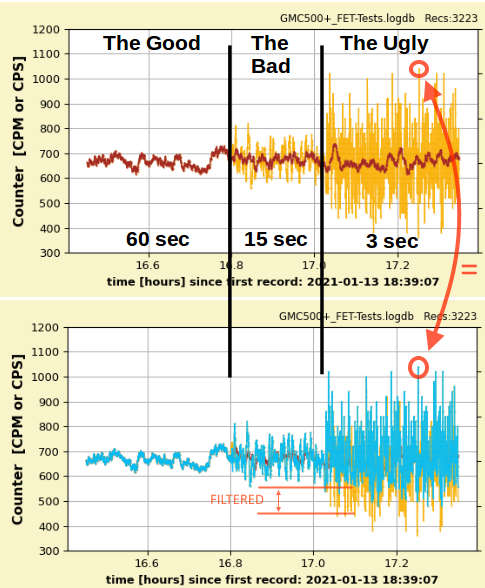
Of course I do not intend to stay in the garage, not even with a gas mask, although seeing me with a gas mask and a lead armor would scare the hell out of all the other residents 
Here are some images from the place, and there are few images I couldn't interpret. For example: If we are talking about Alpha particles coming from the Radon decay, then I would expect the CPM do decrease when I cover the pancake tube/sensor with my hand as that would definitely block alpha particles from reaching the tube. So just for testing, I blocked it with my hand for around a minute while watching the CPM count (you can see some images below while I am holding the counter and blocking the tube), the CPM count rocketed sky high, for one instance it was ready around 840 CPM (couldn't take a photo on that moment)! So if my hand could block alpha particles, does that mean that the counter is detecting gamma? I have no artificially radioactive material in my garage, never had any!
The highest recorded CPM is 309
2021-01-09 16:54:40 309 118.01 0.88 uSv/h
Click on the link for full image if needed
[url=https://ibb.co/zS21WGF] [/url] [/url]
[url=https://ibb.co/CWvMyhR] [/url] [/url]
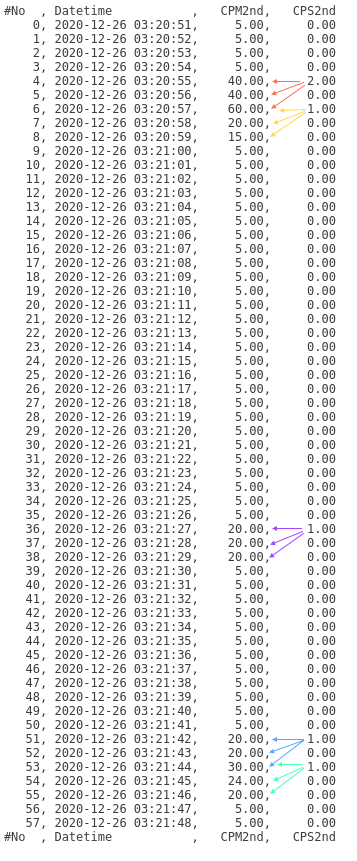
[url=https://ibb.co/RbdRmTz] [/url] [/url]
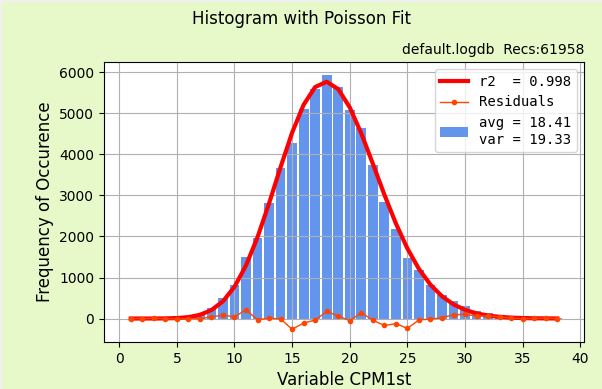
[url=https://ibb.co/r2nx0CL] [/url] [/url]
[url=https://ibb.co/MnDgYkY] [/url] [/url]
[url=https://ibb.co/YbB6zhC] [/url] [/url]
[url=https://ibb.co/vZ6350t] [/url] [/url]
[url=https://ibb.co/kD1rnNp] [/url] [/url]
[url=https://ibb.co/N3BYtHK] [/url] [/url]
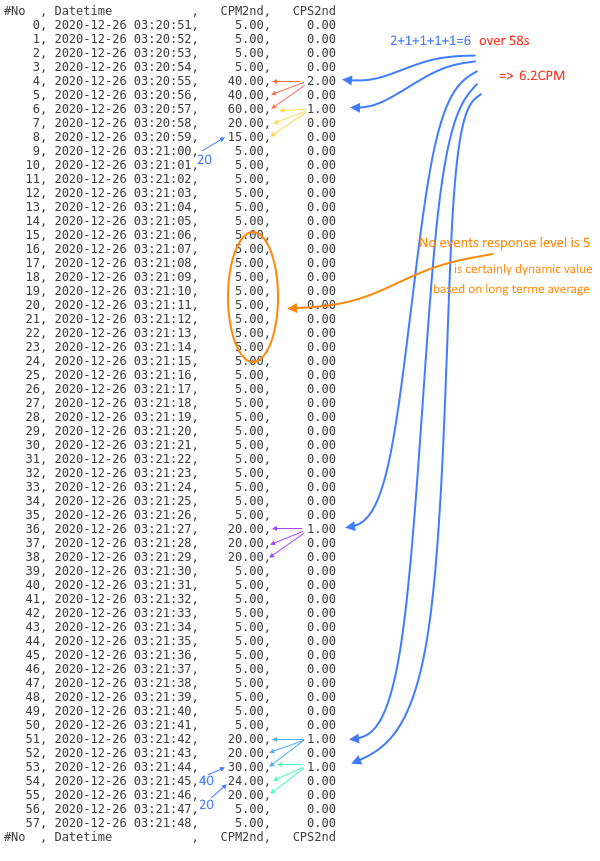
|
Edited by - ihab17 on 01/09/2021 09:19:28 |
 |
|
| Reply #3
Damien68
    
France
780 Posts |
 Posted - 01/09/2021 : 10:01:44 Posted - 01/09/2021 : 10:01:44


|
alpha particles don't go very far in the air (only a few centimeters)
they are dageureuse if they are breathed because it will cause damage in the lungs.
normally placing a hand in front of the window of the sensor should remove alpha radiation, however this should not be done as this meter/sensor is small sensitive to EMI interference, placing a hand against the window of the meter can introduce interference by capacitive coupling , I think that's why you have these readings, or otherwise it would mean your hand is contaminated, but that's unlikely.
it is therefore better to place simply a sheet of paper to do this test.
it is unlikely to be gamma otherwise your old GMC-500 will have detected it.
|
Mastery is acquired by studying, with it everything becomes simple |
Edited by - Damien68 on 01/09/2021 10:55:32 |
 |
|
| Reply #4
ihab17
    
Italy
240 Posts |
 Posted - 01/09/2021 : 11:06:41 Posted - 01/09/2021 : 11:06:41


|
quote:
Originally posted by Damien68
it is unlikely to be gamma otherwise your old GMC-500 will have detected it.
Ok, fair enough. Are you aware of a method of distinguishing the CPM counts which was alpha, beta, or gamma? I know of first reading with a thin sheet of paper to block alpha and take readings (beta and gamma left), then cover the counter window with a 7mm plastic piece to block both alpha and beta which makes the rest of the reading only gamma. Other than that, is there a way natively out of the box to distinguish between the counts without this method? Or there is another method I am not aware of?
Thanks |
 |
|
| Reply #5
Damien68
    
France
780 Posts |
 Posted - 01/10/2021 : 00:45:48 Posted - 01/10/2021 : 00:45:48


|
Hello ihab17,
no this is the method, I do not know others.
what you can also try is to place the meter close to your wall,
at my home it significantly increases the number of CPM I do not know if it is radon in the wall or the materials used for construction. |
Mastery is acquired by studying, with it everything becomes simple |
Edited by - Damien68 on 01/10/2021 01:18:45 |
 |
|
| Reply #6
ihab17
    
Italy
240 Posts |
|
| Reply #7
Damien68
    
France
780 Posts |
 Posted - 01/10/2021 : 02:29:04 Posted - 01/10/2021 : 02:29:04


|
| Itís impressive, I would have to decide to buy a GMC-600+ for the moment I only have a GMC-500+. |
Mastery is acquired by studying, with it everything becomes simple |
 |
|
| Reply #8
ihab17
    
Italy
240 Posts |
 Posted - 01/10/2021 : 03:52:51 Posted - 01/10/2021 : 03:52:51


|
quote:
Originally posted by Damien68
Itís impressive, I would have to decide to buy a GMC-600+ for the moment I only have a GMC-500+.
Can this imply a residue of Radon attached to dust particles stuck on the wall?
I am sure you already know this, but having had both GMC-500+ and GMC-600+, I can tell you with confidence that
1: A pancake counter with thin Mica is much sensitive than a tube
2: The GMC-600+ has a LND-7317 pancake counter with mica window that makes reading more accurate and the sensor is more sensible
3: GMC-600+ Can detect alpha particles which definitely would increase the CPM counts thus you have to shift your normal and average to a higher values!
I'll try to collect some dust with a vacuum cleaner then try to measure the radioactivity of the dust/dirt collected. |
 |
|
| Reply #9
Damien68
    
France
780 Posts |
 Posted - 01/10/2021 : 07:32:13 Posted - 01/10/2021 : 07:32:13


|
quote:
Can this imply a residue of Radon attached to dust particles stuck on the wall?
yes there is every chance, radon particles, and daughter particles (polonium, bismuth, lead) can attached to dust particles, and in time there is also daughter particles who will emit alpha, beta and gamma.
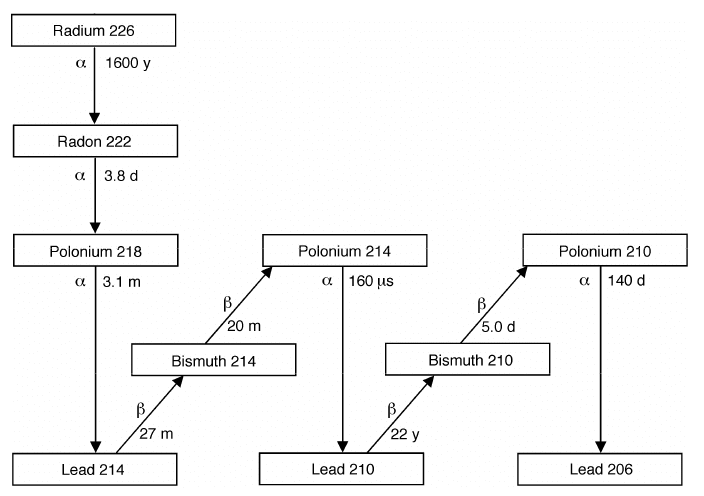
Source: https://www.researchgate.net/figure/The-Basic-Radon-222-Rn-Decay-Chain-The-isotopes-and-their-atomic-masses-are-shown_fig1_51026112
but I don't know exacly why but you have max 10 minuts after vacuuming to measure the radiation, afterwards radiations decreases quickly. |
Mastery is acquired by studying, with it everything becomes simple |
Edited by - Damien68 on 01/10/2021 07:43:52 |
 |
|
| Reply #10
ihab17
    
Italy
240 Posts |
|
| Reply #11
ullix
    
Germany
1241 Posts |
 Posted - 01/12/2021 : 06:59:53 Posted - 01/12/2021 : 06:59:53


|
@ihab17: the CPM display seems to be fluctuating quite a bit. Does this counter have a "Fast Estimate Time" setting, and did you switch it off, i.e. did you set it to 60 seconds?
Read here http://www.gqelectronicsllc.com/forum/topic.asp?TOPIC_ID=9497 where eventually this setting was found to be the cause of all CPM counting problems!
Can you provide the composition of the wall material? Somehow I doubt that this material can give a significant radioactive count. And even alpha? Hard to believe.
|
 |
|
| Reply #12
ullix
    
Germany
1241 Posts |
 Posted - 01/12/2021 : 07:31:26 Posted - 01/12/2021 : 07:31:26


|
@ihab17: I am afraid your data are ruined by the "Fast Estimate Time" setting!
I went to your History data that you linked to, exported the data as CSV file, uploaded this into GeigerLog, and got this plot:
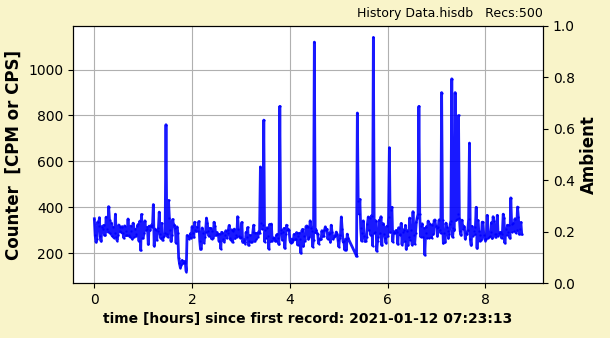
This has the classical marker of the impact of the Fast Estimate time. The spikes are creations of the "Fast Estimate Time" setting, and have nothing to do with radioactive events!
With that kind of time course, it is unnecessary to even look at the Poisson plots, but here you go anyway:
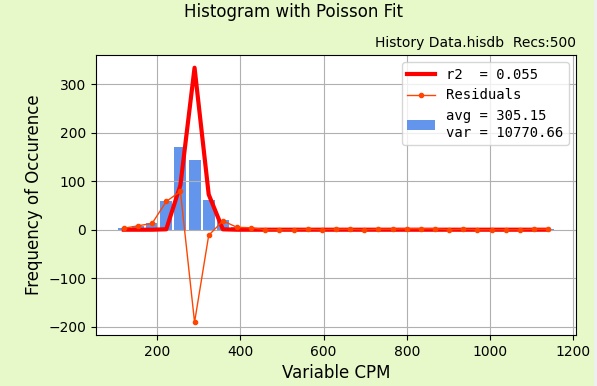
Look at the graph, look at the r-squared value of near-zero, or look at the huge difference between average (305) and variance (10770) - in a good recording the two numbers should be about the same (Poisson Law).
The data are worthless.
|
Edited by - ullix on 01/12/2021 07:37:39 |
 |
|
| Reply #13
Damien68
    
France
780 Posts |
 Posted - 01/12/2021 : 07:41:55 Posted - 01/12/2021 : 07:41:55


|
in the cinder block you can find just about anything. it's a very complexe thing.
but I think more about radon.
|
Mastery is acquired by studying, with it everything becomes simple |
Edited by - Damien68 on 01/12/2021 08:10:21 |
 |
|
| Reply #14
ihab17
    
Italy
240 Posts |
 Posted - 01/12/2021 : 08:24:14 Posted - 01/12/2021 : 08:24:14


|
quote:
Originally posted by ullix
Can you provide the composition of the wall material? Somehow I doubt that this material can give a significant radioactive count. And even alpha? Hard to believe.
Thanks for replying ullix and Damien
I will check and let you know, as the counter is below in the garage and I go there once in a while to check some stuff. I will definitely check the Fast Estimate Time and let you know. Is it enabled by default? Because I remember that I performed a factory reset to load the default values and all I have done afterwards is reconfigure the Wi-Fi settings, but I'll definitely check it and let you know |
 |
|
| Reply #15
ihab17
    
Italy
240 Posts |
 Posted - 01/12/2021 : 08:28:07 Posted - 01/12/2021 : 08:28:07


|
quote:
Originally posted by ullix
Can you provide the composition of the wall material? S
Frankly speaking I don't know, it is just a simple cement brick wall that separates my garage from the other garages. I bought this apartment 2 years ago and I don't have any documentation regarding the materials used, but I assume it is the classical cement brick.
Now I am even more determined to verify the source of the radiation and I'll go down right now and verify |
 |
|
| Reply #16
ihab17
    
Italy
240 Posts |
 Posted - 01/12/2021 : 08:55:35 Posted - 01/12/2021 : 08:55:35


|
| I found the Fast Estimate Time to be set to Dynamic. Even when I changed it to 60 or 05 seconds,the counter continued as before. What should be the optimal settings here? |
 |
|
| Reply #17
ihab17
    
Italy
240 Posts |
|
| Reply #18
Damien68
    
France
780 Posts |
 Posted - 01/12/2021 : 09:52:29 Posted - 01/12/2021 : 09:52:29


|
If you want fast response time chosen a short time
If you want more stability chosen longer time
If you want compatibility with GeigerLog chosen 60 |
Mastery is acquired by studying, with it everything becomes simple |
Edited by - Damien68 on 01/12/2021 09:54:37 |
 |
|
| Reply #19
ihab17
    
Italy
240 Posts |
 Posted - 01/12/2021 : 11:07:40 Posted - 01/12/2021 : 11:07:40


|
quote:
Originally posted by Damien68
If you want fast response time chosen a short time
If you want more stability chosen longer time
If you want compatibility with GeigerLog chosen 60
I did set it to 60. Hopefully the collected data would be compatible and more accurate
If my data is useless, is there a way to reset everything and delete the data history from the website so that further analysis wouldn't take into account the erroneous data? I guess I have to delete the counter (which hopefully would delete the logs), then re-add it again, am I right?
Thanks |
 |
|
| Reply #20
Damien68
    
France
780 Posts |
 Posted - 01/13/2021 : 00:47:57 Posted - 01/13/2021 : 00:47:57


|
Like said Ullix, to make representative measurements, it is necessary to make a recording over a long period (minimum 1 hour, and more if you want more precision or confidence), it is then practical to use a software like geigerLog which will also allow to validate the measure using a histogram and other statistical tools.
Because each radioactive particule emissions are individualy pure random events, it obeys certain rules and consistency with it can be checked by GeigerLog. if the consistency is good, we can then validate the measurement at this time or otherwise estimate the confidence that we can give it |
Mastery is acquired by studying, with it everything becomes simple |
Edited by - Damien68 on 01/13/2021 02:35:08 |
 |
|
| Reply #21
Damien68
    
France
780 Posts |
 Posted - 01/13/2021 : 01:12:09 Posted - 01/13/2021 : 01:12:09


|
Short time fast estimation mode can be usefull if you want to look for a radiation source anywhere, with a short estimation time we can move the GM-counter more quickly, mesurement is more reactive but less acurates.
Otherwise a slower mode is definitely better. |
Mastery is acquired by studying, with it everything becomes simple |
Edited by - Damien68 on 01/13/2021 02:05:23 |
 |
|
| Reply #22
ihab17
    
Italy
240 Posts |
 Posted - 01/13/2021 : 02:55:57 Posted - 01/13/2021 : 02:55:57


|
quote:
Originally posted by Damien68
Short time fast estimation mode can be usefull if you want to look for a radiation source anywhere, with a short estimation time we can move the GM-counter more quickly, mesurement is more reactive but less acurates.
Otherwise a slower mode is definitely better.
Fair enough. I set the Fast Estimate Time to 60, and did a reset of the counters since yesterday. Then pointed again the counter to the wall as in my video and it is not moving at all, so theoretically the data should be more consistent. I am a newbie to those tools, and I would love if someone can guide me on the usage of GeigerLogs or if someone can validate my data (starting yesterday 12 January 2021, after 22:00)
Thanks |
 |
|
| Reply #23
ullix
    
Germany
1241 Posts |
 Posted - 01/13/2021 : 05:41:41 Posted - 01/13/2021 : 05:41:41


|
quote:
If you want fast response time chosen a short time
If you want more stability chosen longer time
If you want compatibility with GeigerLog chosen 60
Sorry, but what a boatload of nonsense! You understand neither physics, nor Poisson statistics.
GeigerLog is simply a tool to verify parts of the experimental results. And, regarding at least Poisson and Geiger counters, seems to be the only one in the world. As long as the algorithm for Fast Estimate Time is not disclosed, all I can say based on observed facts that the only thing you get faster to is to worthless data.
So, again a request to GQ: please, tell us what the algorithm is, and we can hopefully settle this issue once and for all!. Please.
|
 |
|
| Reply #24
ullix
    
Germany
1241 Posts |
 Posted - 01/13/2021 : 06:30:49 Posted - 01/13/2021 : 06:30:49


|
@ihab17: I am not sure: are you already using GeigerLog?
If yes, then do logging with the counter connected to a computer running GeigerLog. After >10 min press the Poiss button and see if you get a reasonable fit with an r2 (=r-squared) of 0.9 or greater. If not, try again in 10min, repeat if needed.
If no, then we need the history stored on the counter. Make a full reset, and don't forget to reset the FET (Fast Estimate Time) to 60! Also make sure it is storing CPS (in GQ lingo: "CPS, save every minute"). An hour (better longer) later, download the history and let me have it.
This will establish that the counter does reasonable things (or not).
Then I would suggest trying to establish a background baseline.
As there is still the lingering thought of alpha particles from Radon (I'd be surprised, but we can't exclude it yet) let's take some precautions: take a thick plastic bag - like those used in ancient times to store liquid when boarding an airplane - go outside (away from any potential Radon source) aerate the counter and bag for a moment, and seal the counter in the bag as good as you can. Now you have a counter free of any Radon gas; and from the plastic alphas won't be able to penetrate it, but betas and gammas will get through easily.
Now, fully reset the counter again (don't forget FET!). Find 3 places where you let the counter acquire data for ~1h at each location: outside away from any building-stones or natural-stones, and a good distance (~2m) away from ground.
If outside is impossible, choose an inside location as high up as possible, away from the cellar and away from stone walls, like under the roof of a wood covered building (I know ...).
You want only cosmic radiation and as little impact from earth as possible, so figure out how to do it.
Download history and analyze. I guess you will have 3 very similar recordings, and the average CPM will be in the range of 40 ... 60, based on the LND company specified sensitivity of 348 CPM/(ĶSv/h), and compared against my observations on tubes like M4011, SBM20 and the likes, which, with less than half the sensitivity, will give 15 ... 25 CPM. We'll see.
Once this comes out with no surprises, we'll look at your wall again ;-)
|
 |
|
| Reply #25
Damien68
    
France
780 Posts |
 Posted - 01/13/2021 : 07:16:27 Posted - 01/13/2021 : 07:16:27


|
quote:
Originally posted by ullix
quote:
If you want fast response time chosen a short time
If you want more stability chosen longer time
If you want compatibility with GeigerLog chosen 60
Sorry, but what a boatload of nonsense! You understand neither physics, nor Poisson statistics.
GeigerLog is simply a tool to verify parts of the experimental results. And, regarding at least Poisson and Geiger counters, seems to be the only one in the world. As long as the algorithm for Fast Estimate Time is not disclosed, all I can say based on observed facts that the only thing you get faster to is to worthless data.
So, again a request to GQ: please, tell us what the algorithm is, and we can hopefully settle this issue once and for all!. Please.
I'm not sure the problem is my understanding.
|
Mastery is acquired by studying, with it everything becomes simple |
Edited by - Damien68 on 01/13/2021 07:22:59 |
 |
|
| Reply #26
ihab17
    
Italy
240 Posts |
 Posted - 01/13/2021 : 08:43:24 Posted - 01/13/2021 : 08:43:24


|
quote:
Originally posted by ullix
@ihab17: I am not sure: are you already using GeigerLog?
Sorry for the heat generated from my post, I intend no harm or create any type of misunderstanding. I am new to the Geiger Counters and do not comprehend the algorithms behind it. I've seen GeigerLog from SourceForge and saw that you are the author, and I am delighted and honored to talk to you.
What that said, my answer is NO, I still didn't use the GeigerLog software, I use a Windows computer and I don't know which file I should download and run.
This could be an opportunity for me to learn how to download, run, and interpret the data, and I can help you with the writing of the documentation for beginners like me, including step by step configurations, scientific literature, and various links.
I know now from your comment that the QG folks did not publicly disclose their algorithm |
 |
|
| Reply #27
ihab17
    
Italy
240 Posts |
 Posted - 01/13/2021 : 10:32:47 Posted - 01/13/2021 : 10:32:47


|
quote:
Originally posted by ullix
@ihab17: I am not sure: are you already using GeigerLog?
Ok, so I performed a full reset, set the FET to 60, deleted the counter from the map and deleted all the data online. Configured the Wifi again with the new counter ID
Note: The counter cannot connect to 5GHz Wi-Fi networks, neither connect to any Wi-Fi if the Wi-Fi mode is set to WPA2+WPA3, it has to be at most WPA2 (CCMP) and has to be 2.4 GHz
I have difficulties doing what you asked me to get a reasonable reading, do you think if I leave the counter in a sealed bag on an aluminum ladder on my balcony would suffice or that would still alter the readings? The height from the floor to the ceiling in my balcony is 2.8m so if I seal the counter and place it in the middle of the balcony on the aluminum ladder would that work? I can leave it there for hours/days no problem and I can leave it attached to a power source to keep it fully charged
As for the use of the software, I am still reading the PDF trying to get acquainted with how to use it on Windows |
 |
|
| Reply #28
ihab17
    
Italy
240 Posts |
 Posted - 01/13/2021 : 12:28:06 Posted - 01/13/2021 : 12:28:06


|
| I also noticed something regarding the GMC-600+. If you cover/block the sensor with any material (plastic, wood, or even your arm), the CPM increases from an average count of 60 to an average count of over 95 CPM. Is this expected? |
 |
|
| Reply #29
EmfDev
    
2392 Posts |
 Posted - 01/13/2021 : 14:27:13 Posted - 01/13/2021 : 14:27:13


|
The calculation for fast Estimate is:
Let x = duration in seconds
Estimated CPM = SUM(Last X seconds CPS reading) * (60/X)
e.g. for 5 sec fast estimate. (e.g. [1, 0, 1, 0, 2] ==> sum = 4)
Estimated CPM = 4 * 60/5 = 4*12 = 48.
for Dynamic Fast Estimate:
x varies depending on how stable the data is from 3 seconds to 60 seconds. If the latest few CPS is significantly higher than the average CPS then the x goes to 3 for 3 seconds and then starts going to 60 as long as the CPS is stable or around certain range from the average CPS. If dynamic estimate reaches 60 seconds reading then it becomes the same as 60 second reading, then when there is sudden change in CPS again it will trigger to change back to estimate faster.
These numbers are called "estimate" for a reason and so the accuracy is not that great. Some users who survey the unknown do not want to put the unit there for too long and just wants to get an estimate or check if there is radiation.
|
 |
|
| Reply #30
EmfDev
    
2392 Posts |
 Posted - 01/13/2021 : 14:37:56 Posted - 01/13/2021 : 14:37:56


|
| @ihab, in covering the unit, it is possible that static EF is affecting it, however it is also possible that it is detecting radiation from the materials of the covers (e.g. Potassium). |
 |
|
| Reply #31
ihab17
    
Italy
240 Posts |
 Posted - 01/13/2021 : 16:39:37 Posted - 01/13/2021 : 16:39:37


|
quote:
Originally posted by EmfDev
@ihab, in covering the unit, it is possible that static EF is affecting it, however it is also possible that it is detecting radiation from the materials of the covers (e.g. Potassium).
It is the original wrapping plastic with bubbles that the counter came with, could this be radioactive as well? It must be static electric field then. I'll try covering it with different materials and see what happens, I'm still testing |
 |
|
| Reply #32
ullix
    
Germany
1241 Posts |
|
| Reply #33
WigglePig
  
31 Posts |
 Posted - 01/14/2021 : 02:24:19 Posted - 01/14/2021 : 02:24:19


|
quote:
Originally posted by EmfDev
The calculation for fast Estimate is:
Let x = duration in seconds
Estimated CPM = SUM(Last X seconds CPS reading) * (60/X)
e.g. for 5 sec fast estimate. (e.g. [1, 0, 1, 0, 2] ==> sum = 4)
Estimated CPM = 4 * 60/5 = 4*12 = 48.
for Dynamic Fast Estimate:
x varies depending on how stable the data is from 3 seconds to 60 seconds. If the latest few CPS is significantly higher than the average CPS then the x goes to 3 for 3 seconds and then starts going to 60 as long as the CPS is stable or around certain range from the average CPS. If dynamic estimate reaches 60 seconds reading then it becomes the same as 60 second reading, then when there is sudden change in CPS again it will trigger to change back to estimate faster.
These numbers are called "estimate" for a reason and so the accuracy is not that great. Some users who survey the unknown do not want to put the unit there for too long and just wants to get an estimate or check if there is radiation.
Now, this looks like a reasonable approach but will, as you state and others have suggested, lead to much increased uncertainty where short estimate times are used; a recent burst of counts (or lack thereof) will mean a short FET setting will lead to a large uncertainty in the estimated CPM and possible wild fluctuations in the recorded CPM figure if this is always derived from the "fast estimate" approach.
In the 500+, is the "fast estimate" approach applied to the "overall CPM" or to each of CPM1 and CPM2 individually, before they are added to give the "overall CPMM?"
Whilst I am reasonably new to messing about with Geiger counters and the chemistry and physics related to radiation (I have some experience in the area but not much), I am certainly not new to measurement system design and evaluation, having a background in UKAS testing laboratories, mathematics and electromagnetic (RF) engineering. Because of all this, I find the discussions here extremely interesting although I do note that there is occasionally some misunderstanding borne of miscommunication, shall we say?
All that aside, the units manufactured by GQ do seem on the whole to be pretty good and definitely good value, especially given their general performance for the price.
|
 |
|
| Reply #34
ullix
    
Germany
1241 Posts |
 Posted - 01/14/2021 : 02:58:55 Posted - 01/14/2021 : 02:58:55


|
quote:
I also noticed something regarding the GMC-600+. If you cover/block the sensor with any material (plastic, wood, or even your arm), the CPM increases from an average count of 60 to an average count of over 95 CPM. Is this expected?
Quite disconcerting, and not oberved with other counters. Maybe you can wrap a single layer of aluminum foil (from the kitchen), but cut out a window for the display. May also need a transparent plastic bag to see the dsiplay; bubble wrap may be not suited.
This needs to be solved before you can make serious measurements.
|
 |
|
| Reply #35
Damien68
    
France
780 Posts |
 Posted - 01/14/2021 : 03:05:23 Posted - 01/14/2021 : 03:05:23


|
quote:
Originally posted by WigglePig
I do note that there is occasionally some misunderstanding borne of miscommunication, shall we say?
the misunderstandings are not pleasant but are not important, let's say that in research you have to have a hard head, be a bit like in a ivory tower, otherwise it's more ordinary. |
Mastery is acquired by studying, with it everything becomes simple |
Edited by - Damien68 on 01/14/2021 03:51:52 |
 |
|
| Reply #36
WigglePig
  
31 Posts |
 Posted - 01/14/2021 : 04:18:10 Posted - 01/14/2021 : 04:18:10


|
quote:
Originally posted by EmfDev
@ihab, in covering the unit, it is possible that static EF is affecting it, however it is also possible that it is detecting radiation from the materials of the covers (e.g. Potassium).
Indeed, if you have contaminated dust around in the basement then it is quite likely present on the objects you place over the sensor! |
 |
|
| Reply #37
Damien68
    
France
780 Posts |
 Posted - 01/14/2021 : 04:27:30 Posted - 01/14/2021 : 04:27:30


|
quote:
Originally posted by WigglePig
having a background in UKAS testing laboratories, mathematics and electromagnetic (RF) engineering.
Hi WigglePig,
I have a master of Electronique Automatic Systems, I worked on RFID 'radio frequency identification' (now called NFC) in the early 2000s in the starting introduction of 13.56MHz band technically it is between the induction hob and the RF, now I work more on IOT designs (Wifi Bluetooth,...). |
Mastery is acquired by studying, with it everything becomes simple |
Edited by - Damien68 on 01/14/2021 05:23:22 |
 |
|
| Reply #38
ihab17
    
Italy
240 Posts |
 Posted - 01/14/2021 : 06:10:56 Posted - 01/14/2021 : 06:10:56


|
quote:
Originally posted by WigglePig
...I find the discussions here extremely interesting although I do note that there is occasionally some misunderstanding borne of miscommunication, shall we say?
I can't but agree with you, although I am a newbie to this technology and to this blog, if I way something wrong please do inform me because I'm here to learn and hopefully be able to help others. This is a technical and scientific form and not a Facebook page, so I assume that most of us are science-oriented people trying to learn and help as well
And finally, thanks to GQ Electronics for the reasonably affordable devices that otherwise we would have spent a fortune |
 |
|
| Reply #39
Damien68
    
France
780 Posts |
 Posted - 01/14/2021 : 06:18:36 Posted - 01/14/2021 : 06:18:36


|
quote:
Originally posted by ihab17
quote:
Originally posted by WigglePig
...I find the discussions here extremely interesting although I do note that there is occasionally some misunderstanding borne of miscommunication, shall we say?
I can't but agree with you, although I am a newbie to this technology and to this blog, if I way something wrong please do inform me because I'm here to learn and hopefully be able to help others. This is a technical and scientific form and not a Facebook page, so I assume that most of us are science-oriented people trying to learn and help as well
And finally, thanks to GQ Electronics for the reasonably affordable devices that otherwise we would have spent a fortune
There is really nothing wrong, this blog is exactly for that.
I'm agree: we would have spent a fortune or can't buy it at all, Thanks to GQ Electronics LLC. |
Mastery is acquired by studying, with it everything becomes simple |
Edited by - Damien68 on 01/14/2021 07:34:37 |
 |
|
| Reply #40
ullix
    
Germany
1241 Posts |
 Posted - 01/14/2021 : 07:37:30 Posted - 01/14/2021 : 07:37:30


|
@EmfDev: Thank you for clarifying this now. Much appreciated.
I had expected something of that nature and programmed it into GeigerLog. (Available in the next release, if anyone wants to try it). Except for the "dynamic", which I took as a straight 3 sec setting.
I condensed the results into this pic. The "Fast Estimate Time" (FET) is noted as seconds.
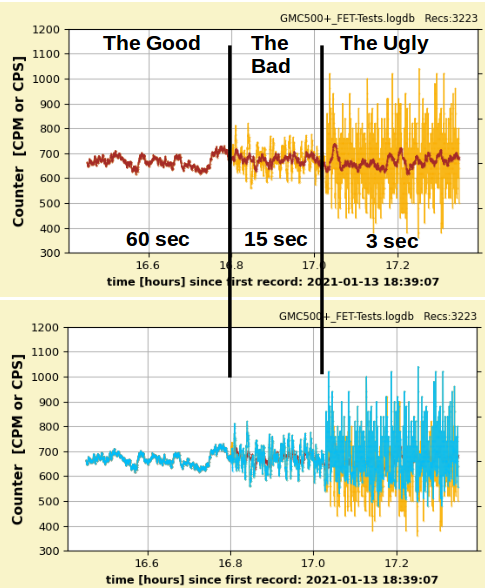
You have 3 CPM traces in total. The
brown:
CPM calculated by GeigerLog as the sum of the last 60 CPS1st (CPS from the 1st, high sensitivity tube) readings from the counter. This trace is INDEPENDENT on FET!
orange:
CPM calculated by GeigerLog by the "Estimated CPM = SUM(Last X seconds CPS reading) * (60/X)" formula, including the 3 sec setting. X here is automatically set to whatever the counter's FET setting is. Thus this trace is dependent on FET!
blue:
CPM as reported by the GMC-500+ counter as CPM1st (CPM from the 1st, high sensitivity tube). This trace is dependent on FET!
The FET was set as indicated on the graph: The Good: 60 sec, The Bad: 15sec, The Ugly: 3 sec. The other FET options were done, but not shown here.
The brown curve is what all traces should have been. In fact in The Good part they all 3 are indistinguishable from each other when overlaid (as they should be, given the algorithm).
In The Bad part the orange curve shows a much wider scatter, but is indistinguishable from the blue one when overlaid. And in The Ugly part, the scatter is even wider.
Of course, the wider scatter is no surprise as with FET you are making a forecast based on only 15, and 3 data points, resp., instead of on 60. So by Poisson's law you get sqrt(60/15)= 2, and sqrt(60/3) = 4.5 fold, resp., wider scatter.
You will also notice that the scatter of the orange curve is approx. symmetric (can't be perfect; it is Poisson), while the blue curve is symmetric only in The Bad part. In the Ugly part you see the top peaks at exactly the same height as the orange ones, while in the bottom end much orange is visible.
So the blue curve is significantly asymmetric. Thus, on average the counter is now producing an average higher than it should be.
The counter in the FET "Dynamic" setting is producing wrong data even when the overall average is taken!
Compare this also with the History shown in Reply #12 of this topic: The spikes are wrong data, and the user was shocked by seeing CPM 1000 and the like. These spikes are spurious events, created by an improper algorithm. This 600+ counter - and all others applying this algorithm - are giving false data.
|
 |
|
| Reply #41
Damien68
    
France
780 Posts |
 Posted - 01/14/2021 : 09:00:39 Posted - 01/14/2021 : 09:00:39


|
@ullix, you are right Poisson distribution is compatible with overlapped Time intervals , Does this present an advantage (best mix)? an enrichment? , Does this present an advantage (best mix)? an enrichment?
keep brown trace as master one to fill histogram, thats all.
choose FET value this is a matter of compromise which may vary from one application to another. but in all cases the user needs to know their device to know what they are doing.
|
Mastery is acquired by studying, with it everything becomes simple |
Edited by - Damien68 on 01/14/2021 10:47:59 |
 |
|
| Reply #42
Damien68
    
France
780 Posts |
 Posted - 01/14/2021 : 09:49:45 Posted - 01/14/2021 : 09:49:45


|
all your tests is static,
you should do the same test by quickly varying the dose of radiation received (ex: 30 to 600CPM), then you will observe reactions
you can do a test in automatic mode too and see what happens.
after you can think of how to have a reliability as with 60s and a reaction as with 3s. there is a solution, the only one I can see would be to run 20 GMC-600+ in same time connected to your software. |
Mastery is acquired by studying, with it everything becomes simple |
Edited by - Damien68 on 01/14/2021 11:16:17 |
 |
|
| Reply #43
ihab17
    
Italy
240 Posts |
 Posted - 01/14/2021 : 14:01:40 Posted - 01/14/2021 : 14:01:40


|
quote:
Originally posted by Damien68
the only one I can see would be to run 20 GMC-600+ in same time connected to your software.
Ha ha ha ha ha ha, a clustered GMC-600+ counters! |
 |
|
| Reply #44
ihab17
    
Italy
240 Posts |
 Posted - 01/14/2021 : 14:04:51 Posted - 01/14/2021 : 14:04:51


|
quote:
Originally posted by ullix
This 600+ counter - and all others applying this algorithm - are giving false data.
Well, if my device itself isn't damaged, then GQ folks should collaborate with you to get a better reading and understanding of what is going on, and maybe release a fix for this in the new firmware? |
 |
|
| Reply #45
Damien68
    
France
780 Posts |
 Posted - 01/15/2021 : 00:35:36 Posted - 01/15/2021 : 00:35:36


|
there is indeed a distortion between the blue and orange curve
the positive peaks of the blue curve are the same as those of the orange curve
for negative peak it looks like GQ has managed to partially filter the negative peaks, apparently their algorithms are more complex than what they announced but that's the kind of thing that should be kept confidential.
But for me the data of the blue curve is more apt to be displayed than that of the orange curve.
|
Mastery is acquired by studying, with it everything becomes simple |
Edited by - Damien68 on 01/15/2021 01:37:32 |
 |
|
| Reply #46
WigglePig
  
31 Posts |
 Posted - 01/15/2021 : 01:36:46 Posted - 01/15/2021 : 01:36:46


|
quote:
Originally posted by Damien68
there is indeed a distortion between the blue and orange curve

Does anyone have the raw CPS data used to generate these graphs please (ullix?) as I would like to have a bit of a play around with the stats this weekend in order to understand the counter FET behaviour a little better? |
 |
|
| Reply #47
Damien68
    
France
780 Posts |
 Posted - 01/15/2021 : 02:10:27 Posted - 01/15/2021 : 02:10:27


|
quote:
Originally posted by WigglePig
Does anyone have the raw CPS data used to generate these graphs please (ullix?) as I would like to have a bit of a play around with the stats this weekend in order to understand the counter FET behaviour a little better?
I don't have this data but Ullix posted interesting RAW datas on following post: http://www.gqelectronicsllc.com/forum/topic.asp?TOPIC_ID=9497
these are data coming from the less sensitive 2nd tube, they are very interesting because as there is very little CPS, we see somes parts of impulse response of the filter. and we find the same phenomenon.
- there is a calculated floor or offset (here of 5) (coresponding to the filtered part)
- and applyed compensation:
#8 CPM is 15 not 20
#53 CPM is 30 not 40
#54 CPM is 24 not 20
 |
Mastery is acquired by studying, with it everything becomes simple |
Edited by - Damien68 on 01/15/2021 02:40:53 |
 |
|
| Reply #48
WigglePig
  
31 Posts |
 Posted - 01/15/2021 : 02:35:39 Posted - 01/15/2021 : 02:35:39


|
quote:
Originally posted by Damien68
quote:
Originally posted by WigglePig
Does anyone have the raw CPS data used to generate these graphs please (ullix?) as I would like to have a bit of a play around with the stats this weekend in order to understand the counter FET behaviour a little better?
I don't have this data but Ullix posted interesting RAW datas on following post: http://www.gqelectronicsllc.com/forum/topic.asp?TOPIC_ID=9497
these are data coming from the less sensitive 2nd tube, they are very interesting because as there is very little CPS, we see the impulse response of the filter. and we find the same phenomenon.
- there is a calculated floor (here of 5)
- and applyed compensation coefficient:
#8 CPM is 15 not 20
#53 CPM is 30 not 40
#54 CPM is 24 not 20

OK, I'm slightly confused now...what filter are you referring to?
From my own counter's captured data I can see that I have perfectly reasonable CPS data from the 1st tube (I have a 500+ running Re2.24) and with the FET fixed at 60 seconds the CPM data looks reasonable:
I avoid using the CPS data because, being close to zero much of the time means that the curve fitting is unpleasant, even if mathematically correct.
From the data shown in the image you posted, I greatly dislike the CPM figures as calculated and I do not understand how they have been obtained.
Since I am fortunate enough (or unfortunate enough in this context) to NOT have a source for elevated counts available to me, I am looking to find a set of real CPS data so I can repeat some analyses myself, to make sure I am completely understanding what is going on in the device.
All of this aside, I would completely expect that with CPS near zero and occasionally one or two counts in a second, extrapolating to obtain a per-minutes count from a short sampling period will ALWAYS result in wildly varying results and spurious high readings.
Basically, estimating the CPM from any data set shorter than a minute will lead to large systematic uncertainties.
Imagine, if you will, a CPS figure of ALWAYS 1...in this case it does not matter what period you estimate from since the result will always be 60 CPM, and any algorithm which does not give 60 in this situation is extremely unfortunate.
Now imagine that the CPS is 1 for all except the 59th second, where it is 10. The shorter the FET chosen, the greater the effect of the CPS for the 59th second will be; the uncertainty in the estimate of CPM will necessarily increase dramatically as the time chosen approaches the minimum.
Any real, raw CPS data from an elevated count situation would be gratefully received, at least until I manage to find something that I can use to collect my own data. |
 |
|
| Reply #49
ihab17
    
Italy
240 Posts |
 Posted - 01/15/2021 : 02:46:16 Posted - 01/15/2021 : 02:46:16


|
quote:
Does anyone have the raw CPS data used to generate these graphs please (ullix?) as I would like to have a bit of a play around with the stats this weekend in order to understand the counter FET behaviour a little better?
Here is my raw data from the counter GMC-600+ exported yesterday, after being fully reset, and FET set to 60. Located outside on a balcony and fully sealed with plastic bags |
 |
|
| Reply #50
Damien68
    
France
780 Posts |
 Posted - 01/15/2021 : 02:56:29 Posted - 01/15/2021 : 02:56:29


|
yes sorry, we mix up a bit because there are two mixed treads
refere to http://www.gqelectronicsllc.com/forum/topic.asp?TOPIC_ID=9497
I'm talking about the GMC-500+, inside there are 2 tube, tube 2 is the low sensitive one and usefull for very hi radiation level.
and the filtering algorithms seem very similar.
on the raw data the filter is the FET in automatique mode for tube 2 |
Mastery is acquired by studying, with it everything becomes simple |
 |
|
| Reply #51
WigglePig
  
31 Posts |
 Posted - 01/15/2021 : 03:04:51 Posted - 01/15/2021 : 03:04:51


|
quote:
Originally posted by Damien68
yes sorry, we mix up a bit because there are two mixed treads
refere to http://www.gqelectronicsllc.com/forum/topic.asp?TOPIC_ID=9497
I'm talking about the GMC-500+, inside there are 2 tube, tube 2 is the low sensitive one and usefull for very hi radiation level.
and the filtering algorithms seem very similar.
on the raw data the filter is the FET in automatique mode for tube 2
Indeed, I have a 500+ running Re2.24 in front of me here, however I don't see the behaviour you indicate with CPM from the second tube in the counter...it reports exactly what I expect from the raw CPS data I see.
You mentioned again a filter; what filter are you referring to? |
 |
|
| Reply #52
Damien68
    
France
780 Posts |
 Posted - 01/15/2021 : 03:06:31 Posted - 01/15/2021 : 03:06:31


|
quote:
Originally posted by WigglePig
quote:
Originally posted by Damien68
quote:
Originally posted by WigglePig
Does anyone have the raw CPS data used to generate these graphs please (ullix?) as I would like to have a bit of a play around with the stats this weekend in order to understand the counter FET behaviour a little better?
I don't have this data but Ullix posted interesting RAW datas on following post: http://www.gqelectronicsllc.com/forum/topic.asp?TOPIC_ID=9497
these are data coming from the less sensitive 2nd tube, they are very interesting because as there is very little CPS, we see the impulse response of the filter. and we find the same phenomenon.
- there is a calculated floor (here of 5)
- and applyed compensation coefficient:
#8 CPM is 15 not 20
#53 CPM is 30 not 40
#54 CPM is 24 not 20

OK, I'm slightly confused now...what filter are you referring to?
From my own counter's captured data I can see that I have perfectly reasonable CPS data from the 1st tube (I have a 500+ running Re2.24) and with the FET fixed at 60 seconds the CPM data looks reasonable:

I avoid using the CPS data because, being close to zero much of the time means that the curve fitting is unpleasant, even if mathematically correct.
From the data shown in the image you posted, I greatly dislike the CPM figures as calculated and I do not understand how they have been obtained.
Since I am fortunate enough (or unfortunate enough in this context) to NOT have a source for elevated counts available to me, I am looking to find a set of real CPS data so I can repeat some analyses myself, to make sure I am completely understanding what is going on in the device.
All of this aside, I would completely expect that with CPS near zero and occasionally one or two counts in a second, extrapolating to obtain a per-minutes count from a short sampling period will ALWAYS result in wildly varying results and spurious high readings.
Basically, estimating the CPM from any data set shorter than a minute will lead to large systematic uncertainties.
Imagine, if you will, a CPS figure of ALWAYS 1...in this case it does not matter what period you estimate from since the result will always be 60 CPM, and any algorithm which does not give 60 in this situation is extremely unfortunate.
Now imagine that the CPS is 1 for all except the 59th second, where it is 10. The shorter the FET chosen, the greater the effect of the CPS for the 59th second will be; the uncertainty in the estimate of CPM will necessarily increase dramatically as the time chosen approaches the minimum.
Any real, raw CPS data from an elevated count situation would be gratefully received, at least until I manage to find something that I can use to collect my own data.
in the supplyed data, if you calculate, 5 is around the CPM average value based on supplyed CPS Data , so all data is corect as an estimate.
The only thing I want to say is that the algorithm is necessarily more complex than advertised, but in my opinion it is excellent. |
Mastery is acquired by studying, with it everything becomes simple |
Edited by - Damien68 on 01/15/2021 03:08:27 |
 |
|
| Reply #53
WigglePig
  
31 Posts |
 Posted - 01/15/2021 : 03:37:12 Posted - 01/15/2021 : 03:37:12


|
quote:
in the supplyed data, if you calculate, 5 is around the CPM average value based on supplyed CPS Data , so all data is corect as an estimate.
The only thing I want to say is that the algorithm is necessarily more complex than advertised, but in my opinion it is excellent.
I'm sorry but I do not understand how you have arrived at ~5 CPM as the average. Performing calculations on the *estimated* CPM values is unwise in the extreme, largely since each calculated value already depends on a number of its predecessors. The only way to reliably use the data to calculate anything is to go back to the "base" data, namely the CPS values which we need to assume are raw counts from the tube.
In your reply you mentioned "we see the impulse response of the filter" but I still do not understand what filter you are referring to... |
 |
|
| Reply #54
Damien68
    
France
780 Posts |
 Posted - 01/15/2021 : 03:55:38 Posted - 01/15/2021 : 03:55:38


|
quote:
Originally posted by WigglePig
quote:
in the supplyed data, if you calculate, 5 is around the CPM average value based on supplyed CPS Data , so all data is corect as an estimate.
The only thing I want to say is that the algorithm is necessarily more complex than advertised, but in my opinion it is excellent.
I'm sorry but I do not understand how you have arrived at ~5 CPM as the average. Performing calculations on the *estimated* CPM values is unwise in the extreme, largely since each calculated value already depends on a number of its predecessors. The only way to reliably use the data to calculate anything is to go back to the "base" data, namely the CPS values which we need to assume are raw counts from the tube.
In your reply you mentioned "we see the impulse response of the filter" but I still do not understand what filter you are referring to...
like said previously:
I'm talking about the GMC-500+, inside there are 2 tube, tube 2 is the low sensitive one and usefull for very hi radiation level.
and the filtering algorithms seem very similar.
on the following raw data the filter is the FET in automatique mode for tube 2 on GMC-500+
we can see with these data why the negative peaks are planed
good after you have to extrapolate to the FET filter of the 600+ but the analogy is obvious
EDIT: Nothings... |
Mastery is acquired by studying, with it everything becomes simple |
Edited by - Damien68 on 01/15/2021 05:04:41 |
 |
|
| Reply #55
WigglePig
  
31 Posts |
 Posted - 01/15/2021 : 05:53:50 Posted - 01/15/2021 : 05:53:50


|
quote:
like said previously:
I'm talking about the GMC-500+, inside there are 2 tube, tube 2 is the low sensitive one and usefull for very hi radiation level.
and the filtering algorithms seem very similar.
on the following raw data the filter is the FET in automatique mode for tube 2 on GMC-500+

we can see with these data why the negative peaks are planed
good after you have to extrapolate to the FET filter of the 600+ but the analogy is obvious
EDIT: Nothings...
Yes, I understand you are talking about the second tube on the 500+; I also have the 500+...
However, I still do not understand where that "base" value of 5 CPM comes from and it is not reflected in the data I see from my own 500+.
There is NO justification for indicating a CPM of 5 from a CPS of zero. The algorithm (is this what you mean by "filter"?) basically produces a "rolling" figure so, were what you were suggesting the case, the calculated CPM should reduce over a period of zero CPS...the CPM data is clearly defective.
Let me reiterate, I do NOT see this behaviour with my own 500+ with the computed CPM for tube 2... |
 |
|
| Reply #56
WigglePig
  
31 Posts |
 Posted - 01/15/2021 : 05:57:04 Posted - 01/15/2021 : 05:57:04


|
Having said that, all of this is besides the point;
Does anyone have a reasonable set of captured data (preferably CPS) with a reasonable source for elevated counts, that they would be willing to let me have to work on over the weekend? |
 |
|
| Reply #57
Damien68
    
France
780 Posts |
 Posted - 01/15/2021 : 07:26:17 Posted - 01/15/2021 : 07:26:17


|
quote:
Originally posted by WigglePig
However, I still do not understand where that "base" value of 5 CPM comes from and it is not reflected in the data I see from my own 500+.
There is NO justification for indicating a CPM of 5 from a CPS of zero. The algorithm (is this what you mean by "filter"?) basically produces a "rolling" figure so, were what you were suggesting the case, the calculated CPM should reduce over a period of zero CPS...the CPM data is clearly defective.
Let me reiterate, I do NOT see this behaviour with my own 500+ with the computed CPM for tube 2...
It taken with new firmware and FET to Dynamic
I would have hoped that this 5 CPM comes from an average estimate made over a long time (1minutes or more) which was consistent in the given context where we have an average of 6.2CPM.
But apparently it's not that at all. |
Mastery is acquired by studying, with it everything becomes simple |
Edited by - Damien68 on 01/15/2021 22:17:13 |
 |
|
| Reply #58
ullix
    
Germany
1241 Posts |
 Posted - 01/16/2021 : 02:44:58 Posted - 01/16/2021 : 02:44:58


|
quote:
Does anyone have a reasonable set of captured data (preferably CPS) with a reasonable source for elevated counts, that they would be willing to let me have to work on over the weekend?
Depends on what you want it for. The GeigerLog package itself comes with data in its data folder.
You find more on my Sourceforge site https://sourceforge.net/projects/geigerlog/files/
Under articles the banana data, under the Data* folders more, like flight-data.
If you are looking for some kind of "clean-room" data, I suggest the synthetic data. https://sourceforge.net/projects/geigerlog/files/Data%20-%20synthetic%20-%20as%20log%20files/
I used them extensively to study GeigerLog's behavior.
If anyone has some important data to share, I'd be happy to post them also on my sourceforege site.
|
Edited by - ullix on 01/16/2021 02:46:46 |
 |
|
| Reply #59
WigglePig
  
31 Posts |
 Posted - 01/18/2021 : 00:48:03 Posted - 01/18/2021 : 00:48:03


|
quote:
It taken with new firmware and FET to Dynamic
<snip>
Ah, there is the issue. Using Dynamic FET you will see a significant offset in the computed values of CPM, especially where the internal FET time changes during a period, shifting the distribution to the right. If you try it with fixed FET times across the range you will see different behaviour. |
 |
|
| Reply #60
Damien68
    
France
780 Posts |
 Posted - 01/18/2021 : 02:20:11 Posted - 01/18/2021 : 02:20:11


|
quote:
Originally posted by WigglePig
Ah, there is the issue. Using Dynamic FET you will see a significant offset in the computed values of CPM, especially where the internal FET time changes during a period, shifting the distribution to the right. If you try it with fixed FET times across the range you will see different behaviour.
and the interest of dynamic mode is not obvious,
planing negative peaks without planing positive peaks gives an unbalanced result may be harder to interpret by an expert eye (even just by looking on the display panel).
|
Mastery is acquired by studying, with it everything becomes simple |
Edited by - Damien68 on 01/18/2021 02:22:11 |
 |
|
| Reply #61
ihab17
    
Italy
240 Posts |
 Posted - 01/19/2021 : 03:06:44 Posted - 01/19/2021 : 03:06:44


|
quote:
Originally posted by EmfDev
The calculation for fast Estimate is:
Let x = duration in seconds
Estimated CPM = SUM(Last X seconds CPS reading) * (60/X)
e.g. for 5 sec fast estimate. (e.g. [1, 0, 1, 0, 2] ==> sum = 4)
Estimated CPM = 4 * 60/5 = 4*12 = 48.
@EmfDev, in case of the GMC-600+, when talking about Tube Settings, what is the best HV Factor to set here? I see the default is set to 164 which almost all the times corresponds to 676V or 677V which seems to be the value of 100% tube voltage (am I mistaken here?). If I set this value to lower or higher values, how would this affect my data collection and accuracy, which currently doesn't seem to fit to GeigerLog analysis and algorithm?
P.S. I am adding screenshots for the others to explore the GMC-600+ features that are not available in other models and not available in the DEMOs
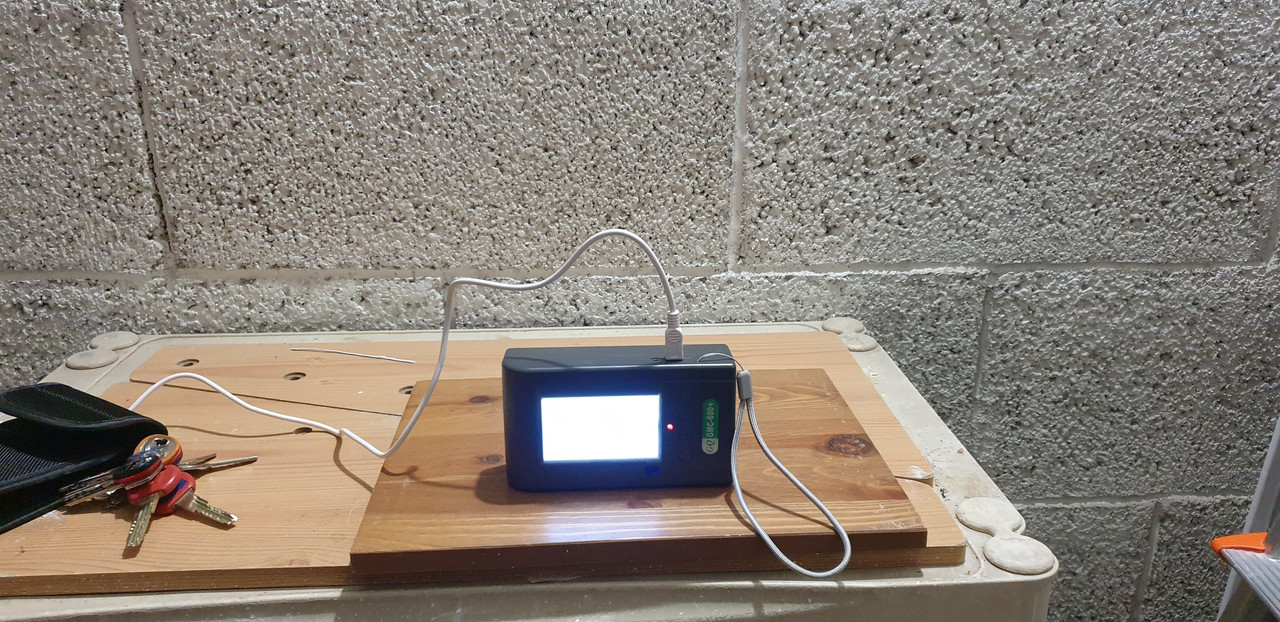
Now after a complete factory reset done yesterday 18 Jan 2021 at around 18:30 GMT+1, I have changed the Fast Estimate Time to 60, and Save Data --> Save Mode to Every Minute. The counter is still in the garage but this time, it is at a distance of more than 50 cm from the wall as you can see from here
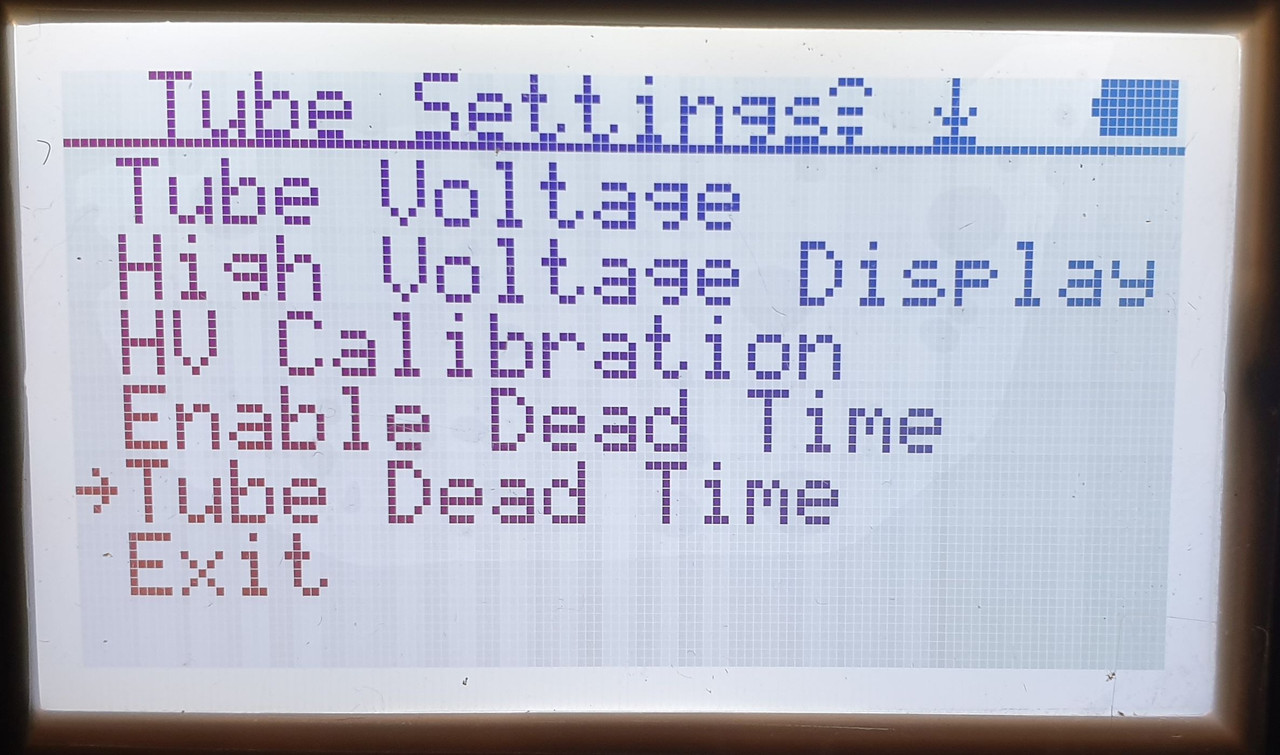
I also went to the Tube Settings as per this image
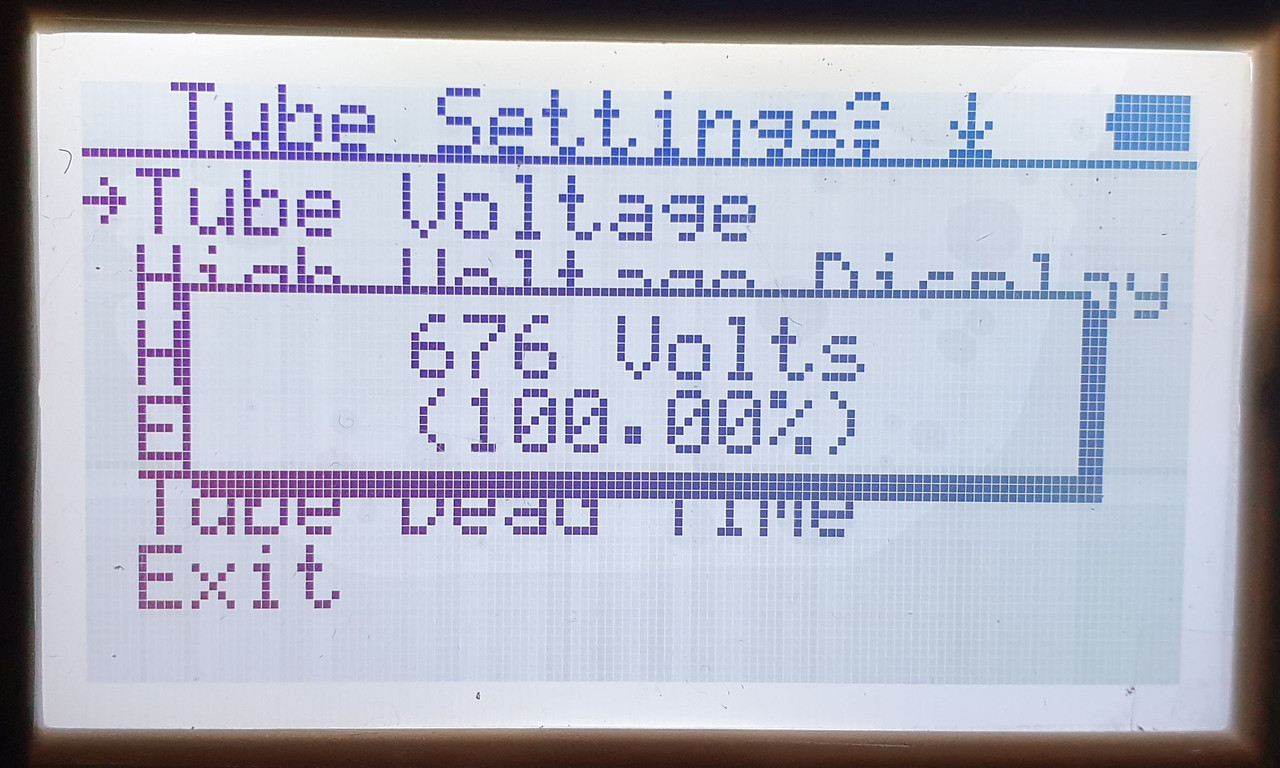
The Tube Voltage displays a value of 676 Volts as 100%
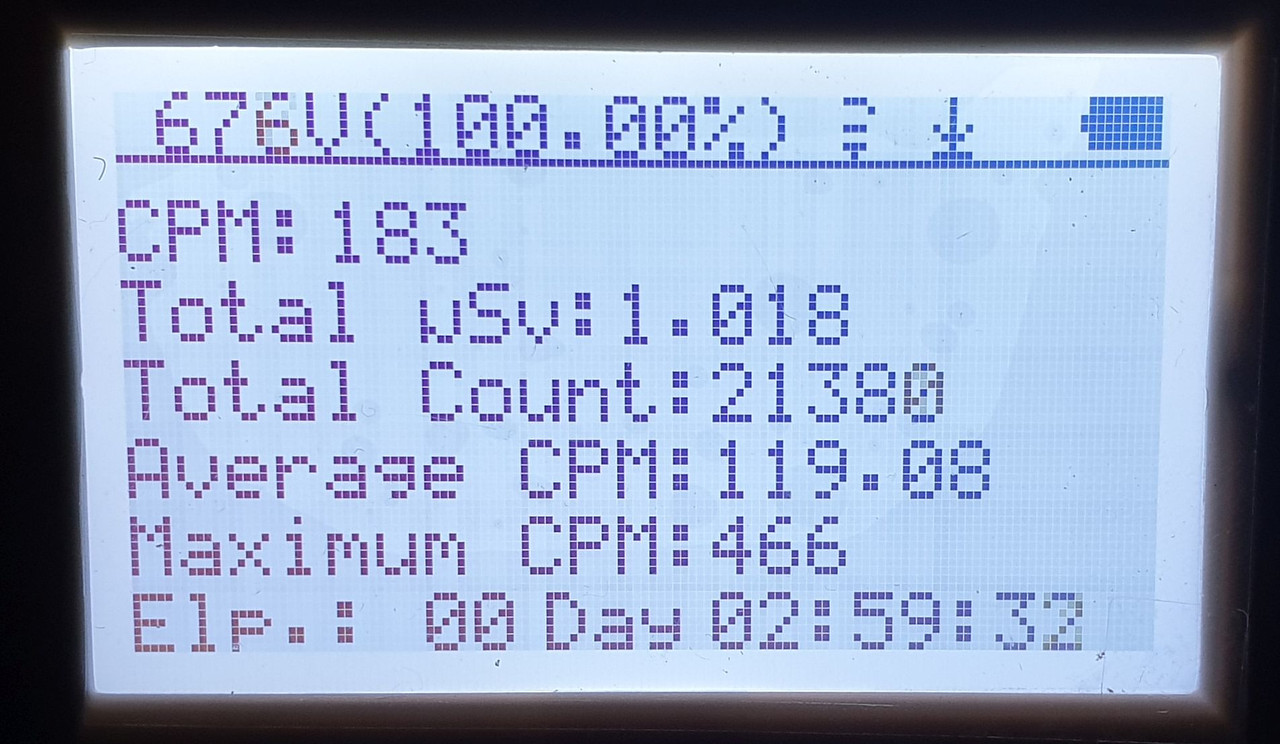
I also selected to display the High Voltage Display option, and I can see that it is the only available option, so either I disable it or select Enabled in Text Mode and I selected the latter
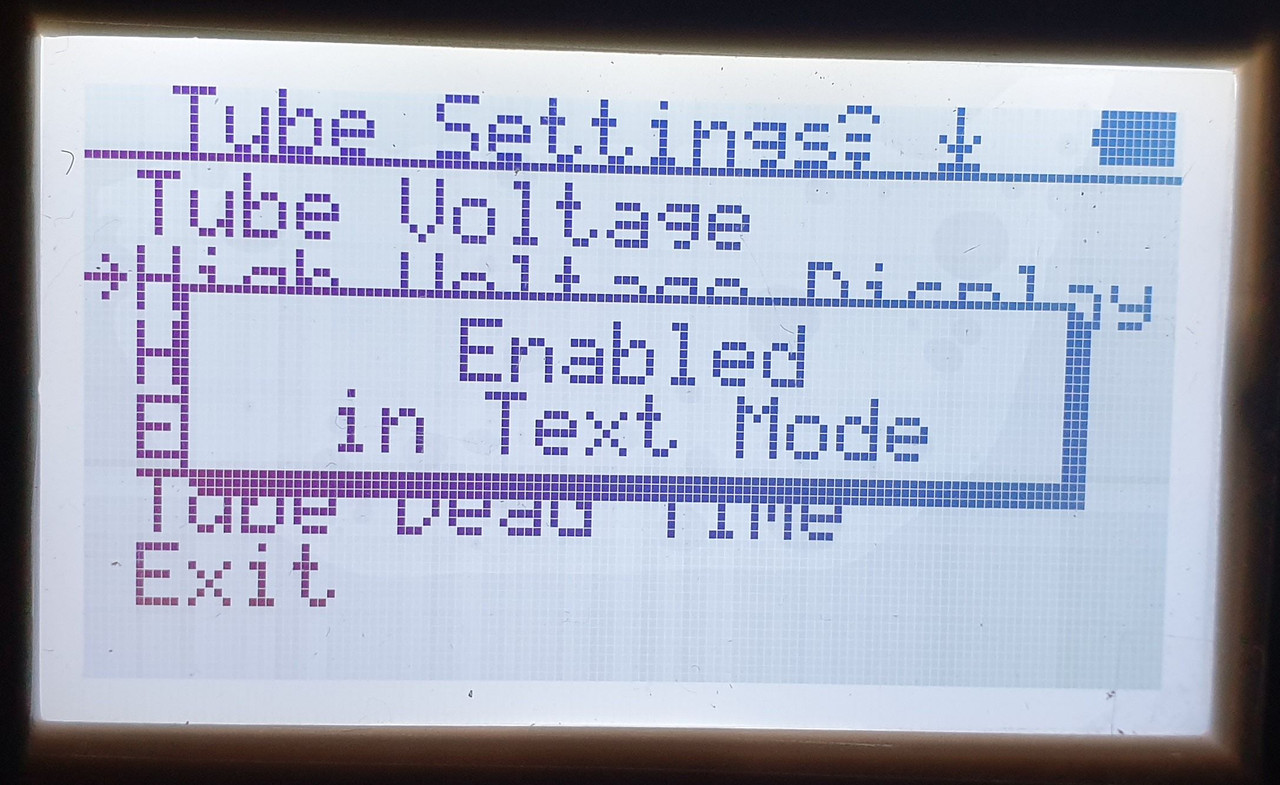
Now in Text Mode display, I can see the High Voltage on the upper left corner of the display
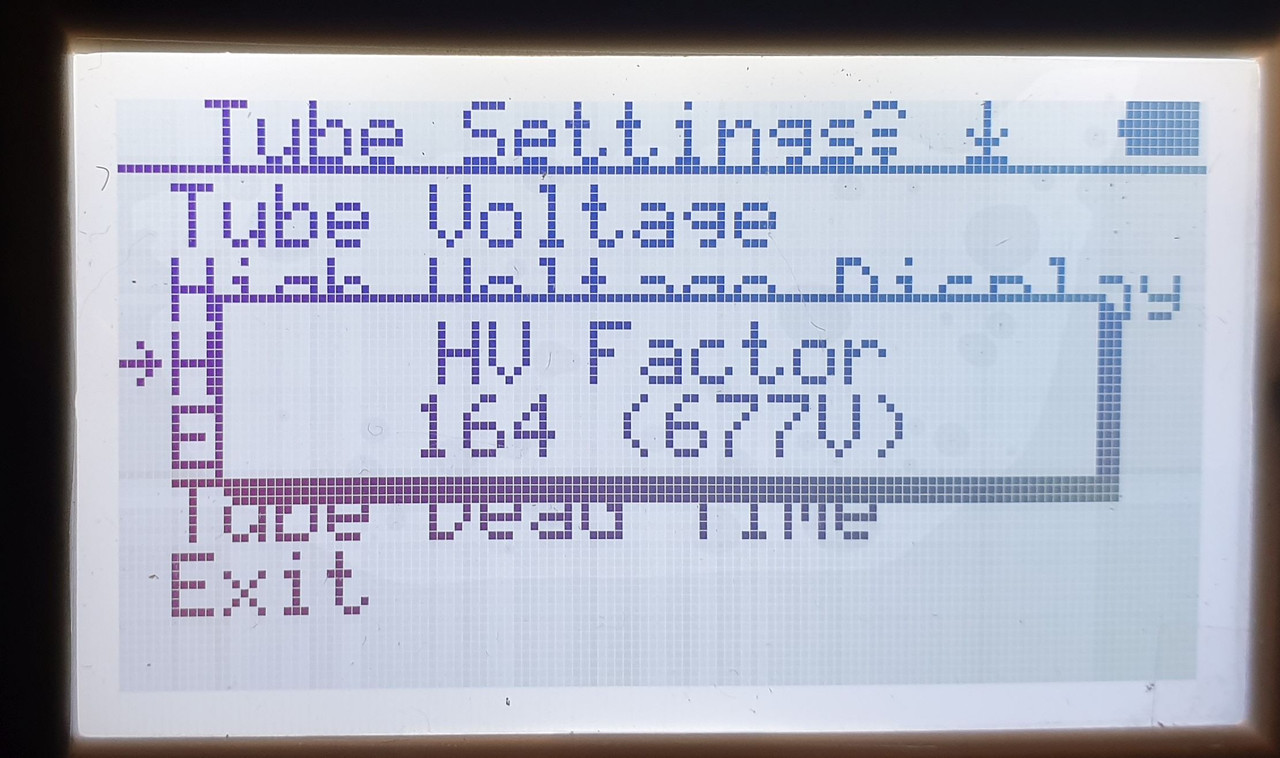
On the HV Calibration item, I can see that the default value is 164 which seems to correspond to 677V (max voltage?), and this can be changed to lower or higher values. What would this do to my collected data if I set it below or above this value? When is it necessary to change it and under what circumstances?
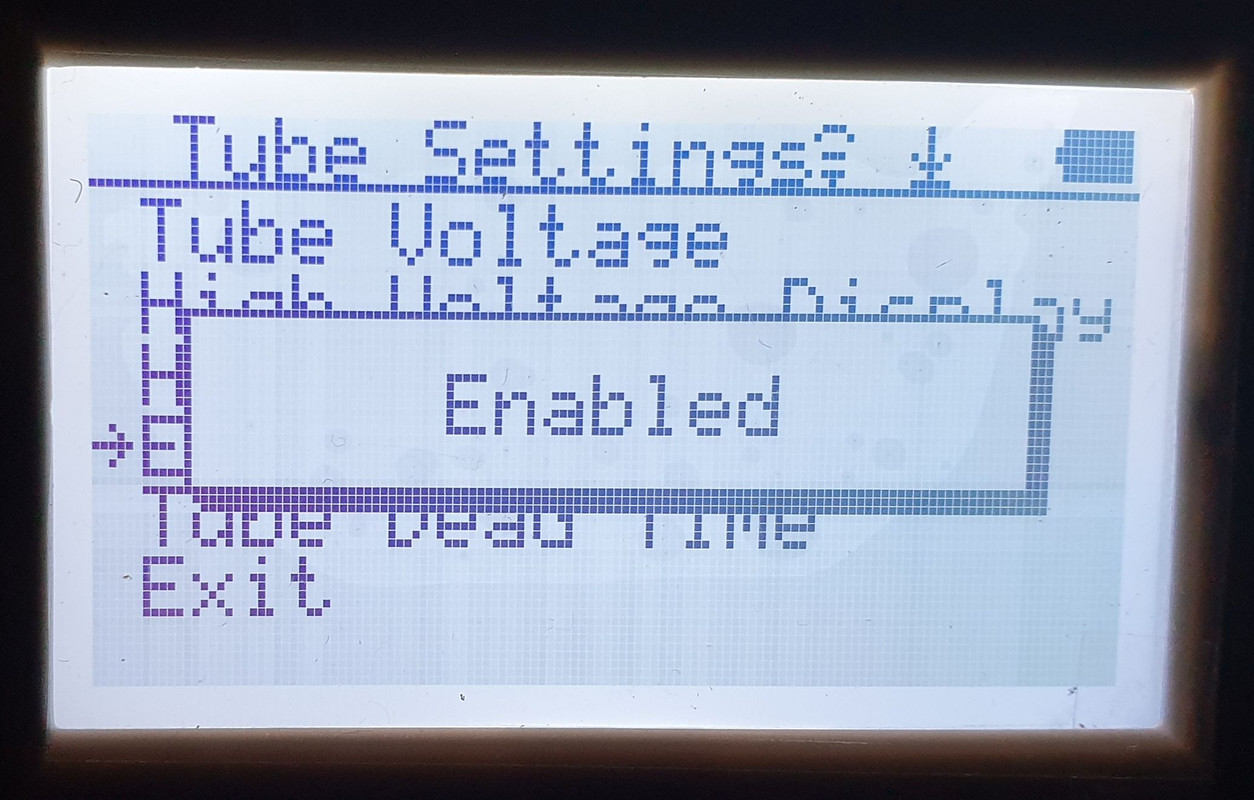
Under Enable Dead Time, I selected Enabled
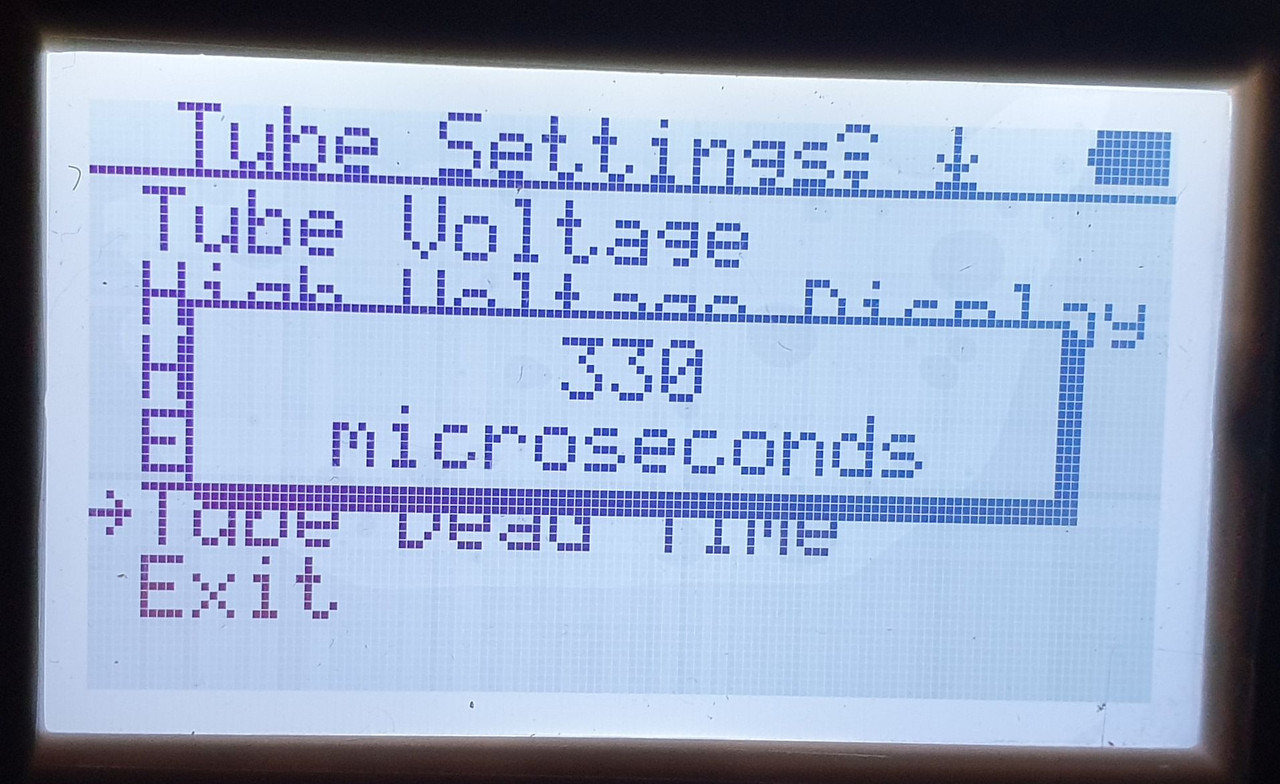
Under Tube Dead Time, I left the default value of 330 microseconds, and here also I would like to have some more info/readings under what circumstances one should try to change this value to otherwise?
For those who want to analyze my collected data, this is the full data link which you can export to CSV https://www.gmcmap.com/historyData.asp?Param_ID=75999374550&systemTimeZone=1
You can discard the first two readings, namely the first two rows at the beginning of the logging, as they correspond to when the counter was at home when I reset it and not in the garage.
2021-01-18 18:30:29 74 64.86 0.21 41.792936 12.61027157
2021-01-18 18:28:23 60 64.55 0.17 41.792936 12.61027157
Consider the first log to be 2021-01-18 19:05:26. The counter has not been removed, moved, or changed as of the writing of this post, 19 Jan 2021 at 12:06 pm GMT+1
Thanks
|
 |
|
| Reply #62
Damien68
    
France
780 Posts |
 Posted - 01/19/2021 : 04:35:24 Posted - 01/19/2021 : 04:35:24


|
By default HV is seted to 100%/676v ?
for reference you can refere to Tube manufacturer datasheet:
https://www.lndinc.com/products/geiger-mueller-tubes/7317/
recomended voltage is 500V, max voltage is 675v, but maybe for some reason GQ prefers to work at the maximum voltage. |
Mastery is acquired by studying, with it everything becomes simple |
Edited by - Damien68 on 01/19/2021 04:41:22 |
 |
|
| Reply #63
ullix
    
Germany
1241 Posts |
 Posted - 01/19/2021 : 04:39:54 Posted - 01/19/2021 : 04:39:54


|
@ihab17:
Some of these numbers seem to be wayyyy out of wack! I'd like to hear from GQ why those were chosen as default?
Assuming a tube LND 7317 you'll find the official datasheet here:
https://www.lndinc.com/products/geiger-mueller-tubes/7317/
The relevant data are these:
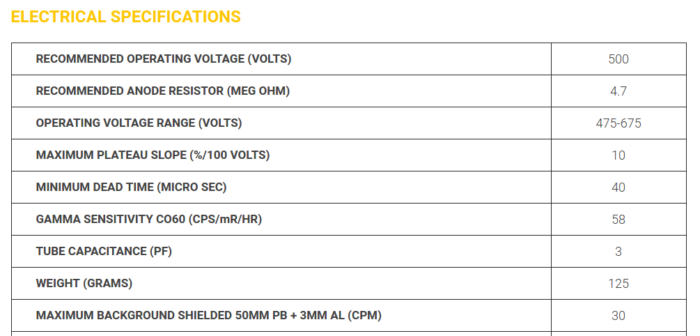
First note the "recommended" voltage is 500V, while ihab shows his 600+ setting at 676V. This is not only MUCH higher, but formally even OUTSIDE the maximum range, and LND might be refusing warranty! Why completely ignoring the manufacturer's spec sheet?
A voltage set too high could well be responsible for too high counts, as the tube may be operating at the edge toward a "fluorescent tube", triggering occasional internal discharges, which will eventually destroy the tube. From my view: very strongly discouraged!
Then the spec sheet shows a "minimum Dead Time of 40us", which is a long way from the 600+ default setting of 330us. This is even much longer than the dead time of the M4011 tube, which was well under 200us. Why that?
If this counter has a high-count correction (has it?) it will trigger this correction too early, thus again creating spurious counts. Another algorithm gone sour?
The Gamma sensitivity for a Co60 source is given by LND as 58 (CPS/mR/HR), which translates to 348 CPM / (uSv/h). Giving this spec is commendable, in particular at the situation that GQ has never given an explanation of the basis of their "calibration factor". And here, where LND gives a clear factor, and GQ never said that it did its own experiment to determine a calibration factor, GQ uses 379 CPM / (uSv/h). On what basis do you decide to increase the listed sensitivity by 9%?
The background given by LND is CPM=30. Ok, this is with some lead shielding, and at home you will see something higher. But when we measure true background, there is cosmic and terrestrial contribution but it will be only gamma. So the sensitivity factors can actually be applied (which isn't the case when you have beta or alpha activity in addition!). For a M4011 the typical background "at home" is 15...20 CPM. With the ratio of LND7317 to M4011 at 348/154 = 2.26, the expected background for a 600+ is 2.26 fold, i.e. 33...45 CPM.
ihab's data are significantly higher than this, even when the Fast Estimate Time is switched off. Why is that?
|
Edited by - ullix on 01/19/2021 04:44:41 |
 |
|
| Reply #64
Damien68
    
France
780 Posts |
 Posted - 01/19/2021 : 04:45:23 Posted - 01/19/2021 : 04:45:23


|
in my opinion the problem of the dead time is as follows and revolves around the HV generator:
in case of high CPM, the weakened HV generator, set to 675v it will drop and even certainly well below 500v.
if the HV voltage drops the deadtime automatically increases exponentially and becomes infinite if the voltage of the HV generator drops below the level of the tube plateau voltage.
It is also when the CPM is high that the dead time is taken into account to make a compensation.
The method is not necessarily stable, and with a $ 100 tube, rather than simply duplicating the HV generator and tinkering with more or less serious compensations, they could have simply added a few components and made a regulated HV generator (COT mode) which would also consume much less energy. This will solve a lot of problems.
|
Mastery is acquired by studying, with it everything becomes simple |
Edited by - Damien68 on 01/19/2021 05:38:27 |
 |
|
| Reply #65
ihab17
    
Italy
240 Posts |
 Posted - 01/19/2021 : 07:41:56 Posted - 01/19/2021 : 07:41:56


|
Here is what I have changed at 16:32pm GMT+1 on January 19th 2021 and I'll leave it like this for 24 hours hoping that someone could analyze the collected data and see if it makes sense
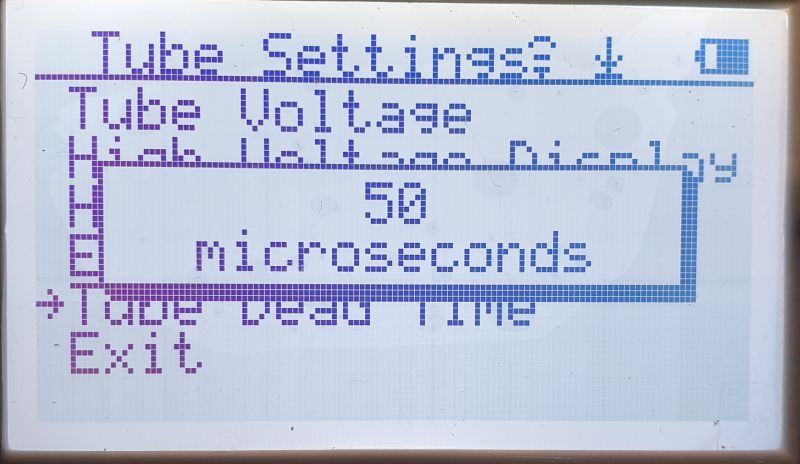
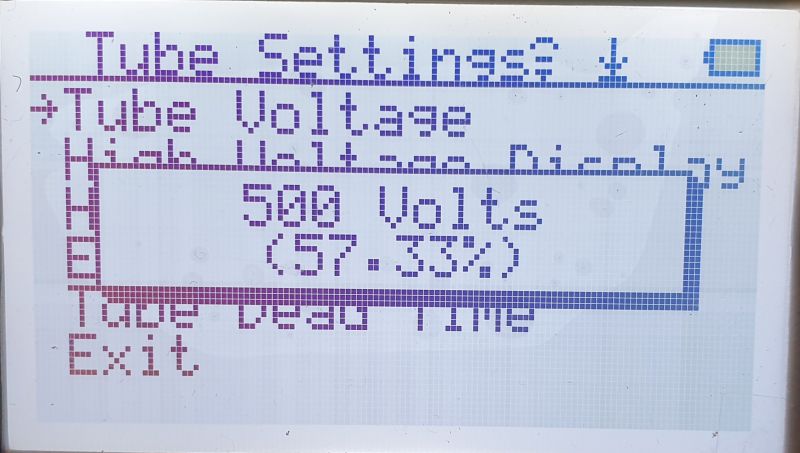
The only thing that I'm not sure about which I left as default is this value
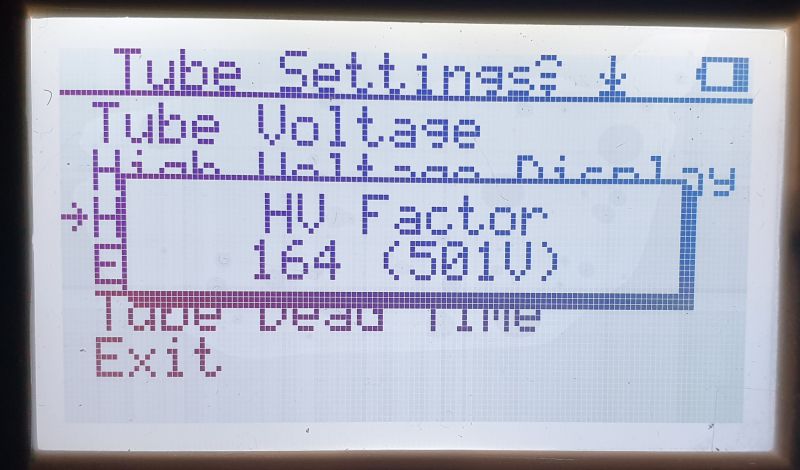
|
Edited by - ihab17 on 01/19/2021 08:50:45 |
 |
|
| Reply #66
ihab17
    
Italy
240 Posts |
 Posted - 01/19/2021 : 12:36:36 Posted - 01/19/2021 : 12:36:36


|
| Boy I am confused more than ever! I did another factory reset and now the Tube Voltage is set back to 580 Volts (72.67%) whereas the previous factory reset gave me another number! I'm scratching my head! The other numbers got back to the default values, i.e HV Factor to 164, Enable Dead Time is enabled, and Tube Dead Time to 270 uSeconds. |
 |
|
| |
 Topic Topic  |
|

