| Author |
 Topic Topic  |
|
|
VeraHG

9 Posts |
 Posted - 02/28/2012 : 00:26:58 Posted - 02/28/2012 : 00:26:58


|
1.) GMC Data Viewer
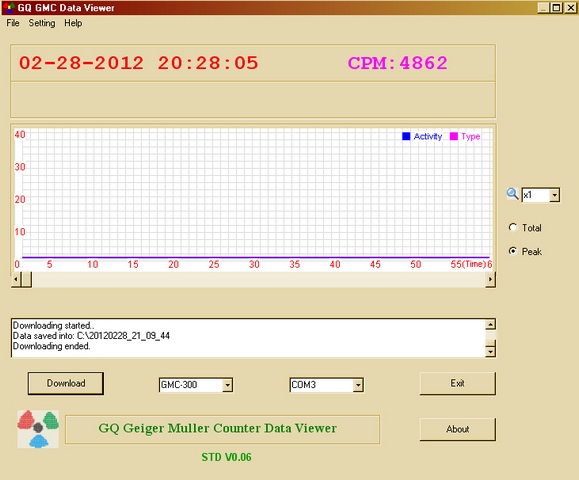
I just received my GQ GMC300. I managed to upload its data via port 3 after a factory reset. I also had to add the .bin after the filenames to be able to load them once downloaded. The data viewer allows me to upload a binary data, and to see the data in an uspecified timeline (uploading date and time given on the top, but that's not equivalent to recording date and time). I can't use the scroller or the arrows. Is it how the DataViewer is supposed to work? If not how can I fix it?
Image Insert:

107.25 KB
2.) Data analysis:
I want to analyse my data mathematically to
- measure CPM on custom timeframes
- draw graphs of custom periods of time with custom data sampling time (obviously longer data sampling time than given on the device)
- analyse the data for decay to identify radiosotopes, for this I have to be able to match lines on the graph and have an acces to their data
- write charts and graphs in either CPM, uSv/h or other
- be able to add signatures and notes to my graphs (date, time. etc)
I would be more than happy to do it manually or with another software, but I need to be able to export my data to a readable format. The information is obviously there, but I need to handle the data file uploaded to the computer.
Can you please advise me in this question? I would also appreciate users' comments and ideas on both issues. |
|
| Reply #1
ZLM
    
1271 Posts |
 Posted - 02/28/2012 : 23:26:33 Posted - 02/28/2012 : 23:26:33


|
The factory reset will erase all history data. So, you will get no data if you download the data after "Factory reset".
Since there is no data, so all scrolling buttons do not work.
There is only a data and time in the data after factory reset. |
 |
|
| Reply #2
VeraHG

9 Posts |
 Posted - 02/29/2012 : 21:31:04 Posted - 02/29/2012 : 21:31:04


|
1.) Thank you for the answer. I was making measurements after the factory reset, but I got interrupted several times, so I don't think it is worth discussing. I am not sure what happened.
Today with measurements in the GMC-300 memory I checked the port assigned by the pc (com4), and downloaded the memory. I had a little problem as the com was opened succesfully, the download started but never got further than 0% on GMC-300 option. I had to chose the GMC-300 Re.2.0 to be able to download a file. I am unsure about the reason (the revision of my GMC is 2.11 but the necessity of the other option still isn't obvious to me).
1.a.) Why do I have to chose GMC-300 Re.2.0?
1.b.) Why didn'T it work with the simple GMC-300 option?
1.c.) Is there a manual available for the program?
Now the file is downloaded, and the zoom function works well. I can also see the note I made (white rain). However
1.d.)The arrows dont work and after scrolling the data will be nil.
1.e.)I can't see the 4 or 5 different measurements I made in the last 2 days for longer periods.
1.f.)I can't see the date and time of the measurement.
1.g.) I can't see the period in which the data was saved
1.h.) I can't convert or export the data
2.)I still would like to know how to
2.a.) Any option or idea how to access the count vs. time data for mathematical analysis.
Can you please address all the questions or issues raised under the certain points?
Lokking forward to the answer,
Vera
Image Insert:

121.8 KB
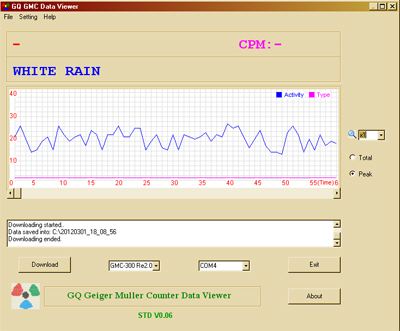
unscrolled view of the dataviewer with the note but no date or cpm data, nor a list of files that should be available for the several different measurements I made
Image Insert:

109.29 KB
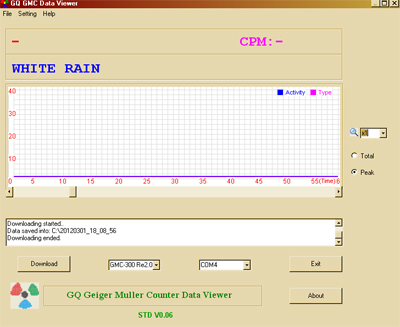
scrolled view of dataviewer, the same file but apparently no data available. No idea what timeframe, file-fragment or what it is showing, or why the arrows dont work. |
 |
|
| Reply #3
ZLM
    
1271 Posts |
 Posted - 03/01/2012 : 00:46:15 Posted - 03/01/2012 : 00:46:15


|
The current software only for simple data view only, no other anaysis and export feature. This will be added in the future software release.
The software slider bar arrows do not work, only slider block works.
The first photo is the begining of the data, but not sure why the date and time are missing.
The second photo is at the middle of the data memory. There are no data there.
Click on the Totol check box at the software left you should see what are the data type.
Can you post your data file here? so that I can check it for you.
|
 |
|
| Reply #4
VeraHG

9 Posts |
 Posted - 03/01/2012 : 01:07:55 Posted - 03/01/2012 : 01:07:55


|
Thanks for the answer ZLM.
Please tell me, if it possible to analyse the data with other softwares? Can it be exported to display time vs data in text?
I will send the files I downloaded in the last 2 days. I added .bin each time to make it recognisable for the data viewer later. I apperciate your help. The one dated today is the file the screenviews are taken of.
Download Attachment:  20120301_18_08_56.bin 20120301_18_08_56.bin
66.23 KB
Download Attachment:  20120228_20_44_33.bin 20120228_20_44_33.bin
66.22 KB
Download Attachment:  20120228_20_23_37.bin 20120228_20_23_37.bin
66.23 KB
Download Attachment:  20120228_19_27_57.bin 20120228_19_27_57.bin
66.24 KB
Download Attachment:  20120228_19_17_41.bin 20120228_19_17_41.bin
66.23 KB
|
 |
|
| Reply #5
ZLM
    
1271 Posts |
 Posted - 03/02/2012 : 22:11:03 Posted - 03/02/2012 : 22:11:03


|
| The data files have no much data. If you want to test the feature, save the data every seconds for more than 10 hours. |
 |
|
| Reply #6
VeraHG

9 Posts |
 Posted - 03/06/2012 : 22:48:03 Posted - 03/06/2012 : 22:48:03


|
I can do that. How much internal memory does the device have? How many data points can it save?
Also, again, can I access the data vs time figure with other softwares? |
 |
|
| Reply #7
ZLM
    
1271 Posts |
 Posted - 03/07/2012 : 22:37:38 Posted - 03/07/2012 : 22:37:38


|
The GMC-300 has 64K Bytes internal memory. It can save Every Second data for about 14~17 hours, Every Minutes Data for about 12 days and Every Hour data for a few month.
There is new software just released Re1.00.
With new software, you can play back the history data with different speed. The Realtime data monitoring is available and you can save the realtime data in different file format with timestamps.
See:
http://www.gqelectronicsllc.com/comersus/store/download.asp |
 |
|
| Reply #8
VeraHG

9 Posts |
 Posted - 03/11/2012 : 13:13:41 Posted - 03/11/2012 : 13:13:41


|
Thank you for the information ZLM, you answered my question in detail. I appreciate it.
I'll check out the new software. I hope that later you can add the deatures that makes it possible to identify radionuclides from the data - I am sure it can be made automatic.
We also managed to decode the .bin datafile and read the raw data, so that's good until the software will be further developed. |
 |
|
| Reply #9
vilagan

Australia
5 Posts |
 Posted - 03/14/2012 : 18:15:48 Posted - 03/14/2012 : 18:15:48


|
Hi VeraHG,
It would be nice if you describe the file layout specs of the .bin datafile that you've obviously decoded for all of us to see too.... that way, we don't have to reinvent the wheel.... who knows, maybe we can come up with some plotting routines which we can share to others using our own software.
Thanks..... |
 |
|
| Reply #10
VeraHG

9 Posts |
 Posted - 03/25/2012 : 00:30:56 Posted - 03/25/2012 : 00:30:56


|
I am enquiring my "decoder person" at the moment, I personally didn't take part in the process. When I get the description I'll post it for you.
However I am very pleased to see that the new software decodes at least the live measurement into a .csv that provides exactly (or almost exactly) the data I was after. Good job, guys, thanks!
|
 |
|
| Reply #11
VeraHG

9 Posts |
 Posted - 03/26/2012 : 22:22:05 Posted - 03/26/2012 : 22:22:05


|
I have talked to him. You can now convert your history .bin data to Excel file .csv by uploading it on: h**p://15october.westportal.co.nz/convert/
If you are from New Zealand, please go to h**p://15october.westportal.co.nz and add your data on the Radiation Related subsite.
|
 |
|
| |
 Topic Topic  |
|

