| Author |
 Topic Topic  |
|
|
kotarak
  
USA
45 Posts |
 Posted - 04/30/2020 : 11:49:40 Posted - 04/30/2020 : 11:49:40


|
Hi,
I am wondering if the GMC-600 Plus firmware/calibration routine accounts for the internal noise / counts of the GM tube?
The more sensitive the tube is, the higher the noise is going to be.
For an example - the GM tube used in GMC-600Plus is LND 7317. LND Inc specifies this tube as max of 30 CPM under heavy shielding conditions (50mm Lead + 3mm Aluminum). The actual count probably is temperature/voltage dependent but it will be nice if the firmware allows you to correct for this.
Granted, 30 CPM is absolutely nothing and can be easily ignored for high level measurements, but when measuring very low-level (background monitoring) and you only read 50-60 CPM, then 30 CPM is really 50% error generated by the tube itself.
It would be great if one can properly shield the counter, take a sample over time of the tube's internal error and then use this value to correct the reading, effectively creating a baseline for zero. This should improve the accuracy of background measurements.
I would like to know if the is done already in the firmware. |
|
| Reply #1
EmfDev
    
2376 Posts |
 Posted - 04/30/2020 : 16:10:12 Posted - 04/30/2020 : 16:10:12


|
| Hi kotarak, there could be noise but the device is calibrated basically with the noise so that the final reading should match the correct one even without factoring out the noise. |
 |
|
| Reply #2
Damien68
    
France
780 Posts |
 Posted - 05/01/2020 : 02:03:12 Posted - 05/01/2020 : 02:03:12


|
The interpretation of the noise of the tube is delicate and nobody does it at root.
We can always withdraw 10 or 15 CPM from the final measurements but it's very subjective. |
Mastery is acquired by studying, with it everything becomes simple |
 |
|
| Reply #3
kotarak
  
USA
45 Posts |
 Posted - 05/01/2020 : 06:08:17 Posted - 05/01/2020 : 06:08:17


|
I understand this, but calibration is usually done at much higher levels using Cs137 or Co60. When the 15-30 error counts are added to the high number of counts, and then this is scaled down to a very low level measurement this will result in very little to no correction. The error in this case I think is not proportional to the overall count number but a fixed value thus if your overall number of counts is <30 the error counts could be nearly 100% error.
I can conduct an experiment and place the tube inside a cloud chamber and compare the visual observation of particles in the area of the tube to the actual counts coming from the tube but the low temperature could skew such measurement. It is easier to put the counter in a heavy lead box and average the counts over 10 minutes.
Would it be possible to make a "feature request" for upcoming firmware release? An item in the calibration menu for "Zero level counts" (GM tube noise error) where a user-specified value is factored in measurements of less than 300 CPM (the 7317 has max of 30 CPM internal noise, thus this step will be reducing the overall error to less than 10% for these low-level measurements |
 |
|
| Reply #4
Damien68
    
France
780 Posts |
 Posted - 05/01/2020 : 09:58:30 Posted - 05/01/2020 : 09:58:30


|
You are right kotarak,
the problem is that the noise of the tube is as random as the signals that we want to detect.
Also the intrinsic noise also responds to a normal distribution, with a variance and an average value.
If we make a calibration offset, the problem is that we can finally obtain sometime negative values.
But sure, it could be filtered with a smart filter, so to interpret the data precisely it would have to take into account its functioning. which in the end would be more complicated.
|
Mastery is acquired by studying, with it everything becomes simple |
Edited by - Damien68 on 05/01/2020 22:57:49 |
 |
|
| Reply #5
Stargazer 40
    
USA
431 Posts |
 Posted - 05/02/2020 : 04:50:43 Posted - 05/02/2020 : 04:50:43


|
| There are a number of factors that affect count. Certainly temp and voltage and to a very large degree the geometry of the GM tube. Measurements I've taken with various GQ and other GM tubes show that calibration can be quite different for some tubes between background/survey and sample type measures. GQ is going to respect background numbers in their calibration and do their best to match known background at their location. Tube noise is essentially a statistical variation of sample time and I think you will get much better numbers if you simply do long Timed Counts and really not worry too much about tube noise. These meters are really good and GQ has gone to some pretty extraordinary lengths to cover a lot of calibration bases, but in the end we are limited by the characteristics of the tubes themselves as to sensitivity. As an example I recently tried to use the 600+ to measure radon in my basement. Lost in the noise. Then I concentrated the dust in a furnace filter that likely contained radon and was able to detect a good change in measure for old dusty filter compared to new out of the box. Haven't found a way to calibrate or standardize that measure, but could see the effect of the concentrated filter dust on the meter. Another point is that whatever you are reading for background, the thing you will be interested in is if it changes. If something no longer is long standing normal or failing to follow some cyclically normal variation. From a background standpoint I think you'll see that just fine. |
Stargazer 40 |
 |
|
| Reply #6
ullix
    
Germany
1235 Posts |
 Posted - 05/02/2020 : 08:13:53 Posted - 05/02/2020 : 08:13:53


|
I am not sure why this discussion is coming up again and again, so let's make clear statements:
First:
There exists no calibration. Period.
If you are of a different opinion, please, present the data. I have asked multiple times for calibration data, and never got any. Nor has any search of the net ever shown any calibration data for the M4011, nor have I seen any for the other tubes in use by GQ.
What I did see are data for the Russian SBM20 tube, and even for that one all reports seem to link to a single source. Find it described in the GeigerLog manual, Appendix G - Calibration. What I found there is that the average of the two SBM20 calibrations done with Co-60 and Ra-226 are so close to what GQ claims as a calibration for the M4011, that I concluded this to be the true pseudo-calibration.
GQ never rejected that conclusion (and never presented any own data). So, for the lack of anything better, this is still it. How good is that? Nobody knows.
Second:
There exists no determination of the background.
Where does this concept of "noise" come from? This terminology is not appropriate for the situation of Geiger counters. And GQ is - correctly - calling it the Instrument background.
The specification of all counters 300, 320 500, 600, 600+ all contain the same statement:
quote:
Instrument Background< 0,2 pulses/s
This is 12 CPM. In most areas this is about half the background count, so worthy to be taken into account, as kotarak wants to do. However, not only are these quite different instruments, there are also very different tubes: M4011 in most, Pancake SBT-11 in the GMC-600, Pancake LND-7317 in the GMC-600+. And all these very different systems come out with the identical background counts? Gimme a break. Where did this claim of 0.2 pulses/s come from? No idea. And GQ isn't telling. It looks like some hand-waving guesses.
I doubt the background was ever determined. However, if it was, describe the test setting and show the data!
Third:
The situation isn't as bad as it sounds.
Sure, these counters are no serious scientific devices. If you are using them, then surely not in a scientific capacity, even if you are a scientist by training. My preferred device is still the good old GMC300E! You basically are using devices with unknown properties, and you'll have to determine its specs by yourself first. Fortunately, radioactive decay has some properties that come really handy with Geiger counters.
One is that Poisson distributions are additive!
Poisson? Some introduction in my GeigerLog manual, more in my Potty Training article, all here: https://sourceforge.net/projects/geigerlog/
The "noise" is not white noise, not pink noise, not red noise of whatever color noise, it is also registered by the counter as having a Poisson distribution. This is important.
Let's for a moment pretend we have the perfect counter with zero background. Then we put a sample of Co-60 next to its left side and measure for a long time, like a day or two. We get, let's say, CPM=100. The we replace it with Ra-226 on its right side, and we may get CPM=250. Then we put both source on the exact same places we had them before, and we get CPM=350. Exactly the sum of the previous measurements. Not a coincidence, but easily verifiable, and despite all the scatter in the data over time the consequence of the Poisson curves being additive!
In a real device, you can think of 1 source being replaced by your background. This is already the sum of your instrument background, plus the cosmic background at your location, plus the background due to e.g. Potassium being in the stonework and tiles in, at, and around your house, plus the potassium within every living creature, be it human, animal, or plant, plus probably more.
The only way to determine true instrument background is to buy a large amount of lead to shield your counter and then measure background. Don't be surprised if you get an even higher background, because you need to purchase this ultra-pure lead without traces of other heavy metals, like uranium, thorium, and friends! All their decay chains go via lead, which is radioactive itself. Though only by a tiny amount, but at what level do you want to end your hunt?
I think it is a pointless endeavor. You will always have to determine the DIFFERENCE between two sources, your sample minus background. Just make sure to measure long enough. An example is shown in my Going Banana article, the successful attempt to demonstrate Potassium in banana, with nothing more than a GMC300E counter and a few days(!) of Geiger counting.
Last thing, I can only emphasize the need to learn to judge the quality of your data, in particular to verify the Poisson-ness of your data!
|
 |
|
| Reply #7
Stargazer 40
    
USA
431 Posts |
 Posted - 05/02/2020 : 08:40:47 Posted - 05/02/2020 : 08:40:47


|
| GQ hasn't publicly released a calibration process but that doesn't mean they don't have a process. We all appreciate that the data 'should' have a Poisson's distribution and thank you for reminding us. Really though these meters are best at relative changes to radioactivity between two sources OR to background over time. Should be 'Nuff Said' at that point. |
Stargazer 40 |
 |
|
| Reply #8
Damien68
    
France
780 Posts |
 Posted - 05/02/2020 : 23:40:56 Posted - 05/02/2020 : 23:40:56


|
You can find the specifications of the 600+ GM tube (including calibration data and background level) on the manufacturer (LND) website:
https://www.lndinc.com/products/geiger-mueller-tubes/7317.
for china tube M4011 of 500+ effectivly there is no public data.
The background is composed on the one hand of the surrounding natural radioactivity.
But on the other hand, If I remember correctly my quantum mechanics lessons which are 30 years old, the GM tube background part is also composed of a tube intrinsec noise, that is to say that the tube under tension will cause from time to time a spontaneous avalanche effect which causes detection without cause (without particles in play). it remains to be verified I am not sure but I do believe that this is the case and that it is due to the probability of collisions of gas particles in the tube ...
If there are physicists who have specifically studied the GM tube, it might be interesting to have their opinions.
the concept of noise is a term used in a very standard way to speak of something that is added to a signal that we want to quantify. but it is true that in this case, signal and background part have same nature (flat-spectrum noise or white noise) and without corelations so we can just add them and you are right we can simply talk about background part
About fish,
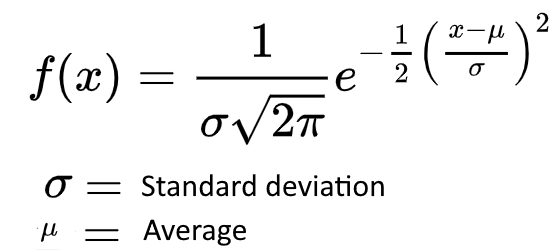
After having collected the data, we can calculate the average and standard deviation of datas,
We can then print on the histogram the Gaussian with the following formula (we juste have to multiply it by a scale value) :
Image Insert:

35540 bytes
https://en.wikipedia.org/wiki/Normal_distribution
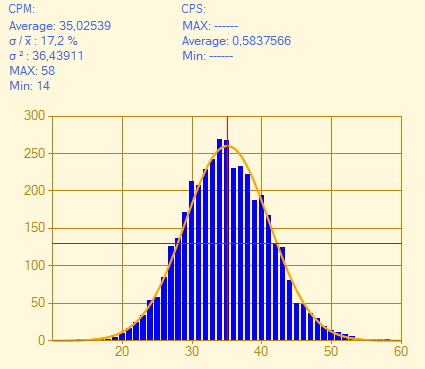
the correct correspondence of the gaussian curve and the histogram signifies the good consistency of the measurements and therefore signifies the validity of the calculated average and variance.
The above function is normalized, that is to say that its integral is worth 1.
to plot it on the histogram you must therefore multiply the above function by a scale coefficient that equal to the sum of all values present in the histogram.
which gives this:
Image Insert:

88359 bytes
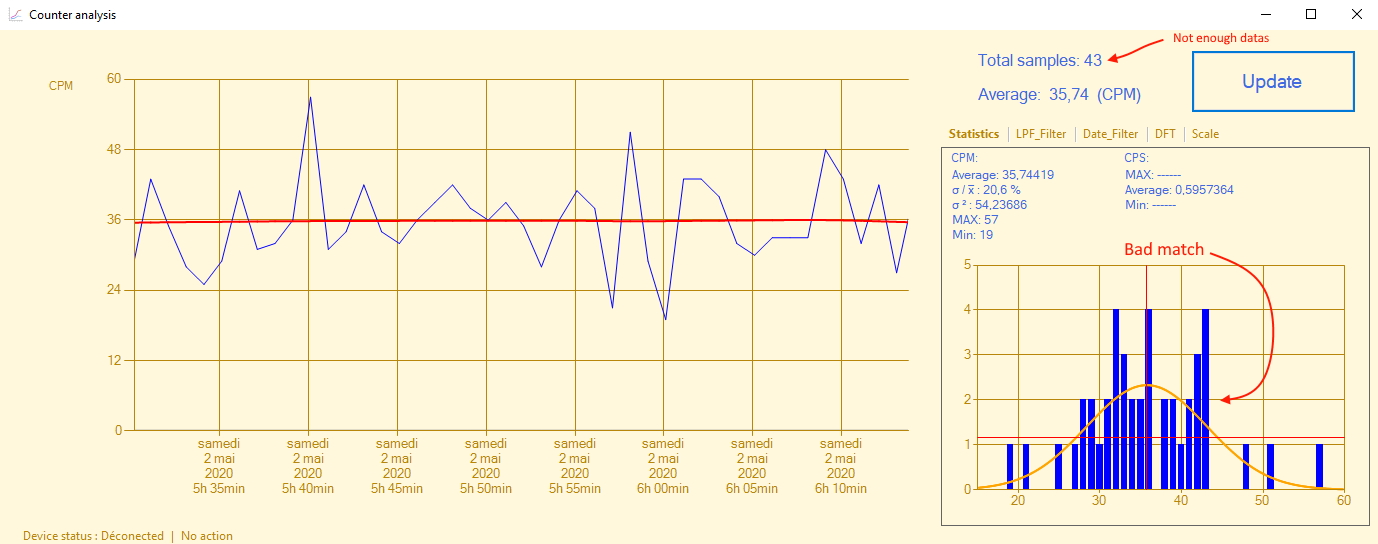
For example if you don't have enough data, the match between Histogrm and 'reference gaussian' becomes not very good and your average mesurment becomes approximate:
Image Insert:

295164 bytes
The fish method is the one that all scientists use to qualify their measurements.
with this principle, we can make very precise measurements with many time.
If you connect two tubes in parallel, you will make measurements with the same precision twice as fast. |
Mastery is acquired by studying, with it everything becomes simple |
Edited by - Damien68 on 05/03/2020 05:04:43 |
 |
|
| |
 Topic Topic  |
|
|
|

