| Author |
 Topic Topic  |
|
|
spot

United Kingdom
7 Posts |
 Posted - 01/21/2018 : 06:17:26 Posted - 01/21/2018 : 06:17:26


|
Every day a seem to have one or two data spikes between 140-155 CPM, often around the same time of day. I doubt it's triggered naturally. What might it be?
My data's on h**p://www.gmcmap.com/historyData.asp?param_ID=71736386667 if anyone wants a look.
Is there a firmware upgrade from 4.11 for the GQ GMC-320+V4?
eta: googling, there's another chap saying similar... h**ps://physics.stackexchange.com/questions/295407/what-would-cause-these-spikes-on-a-nuclear-radiation-graph/349970 |
Edited by - spot on 01/21/2018 06:39:16
|
|
| Reply #1
spot

United Kingdom
7 Posts |
 Posted - 01/21/2018 : 12:18:10 Posted - 01/21/2018 : 12:18:10


|
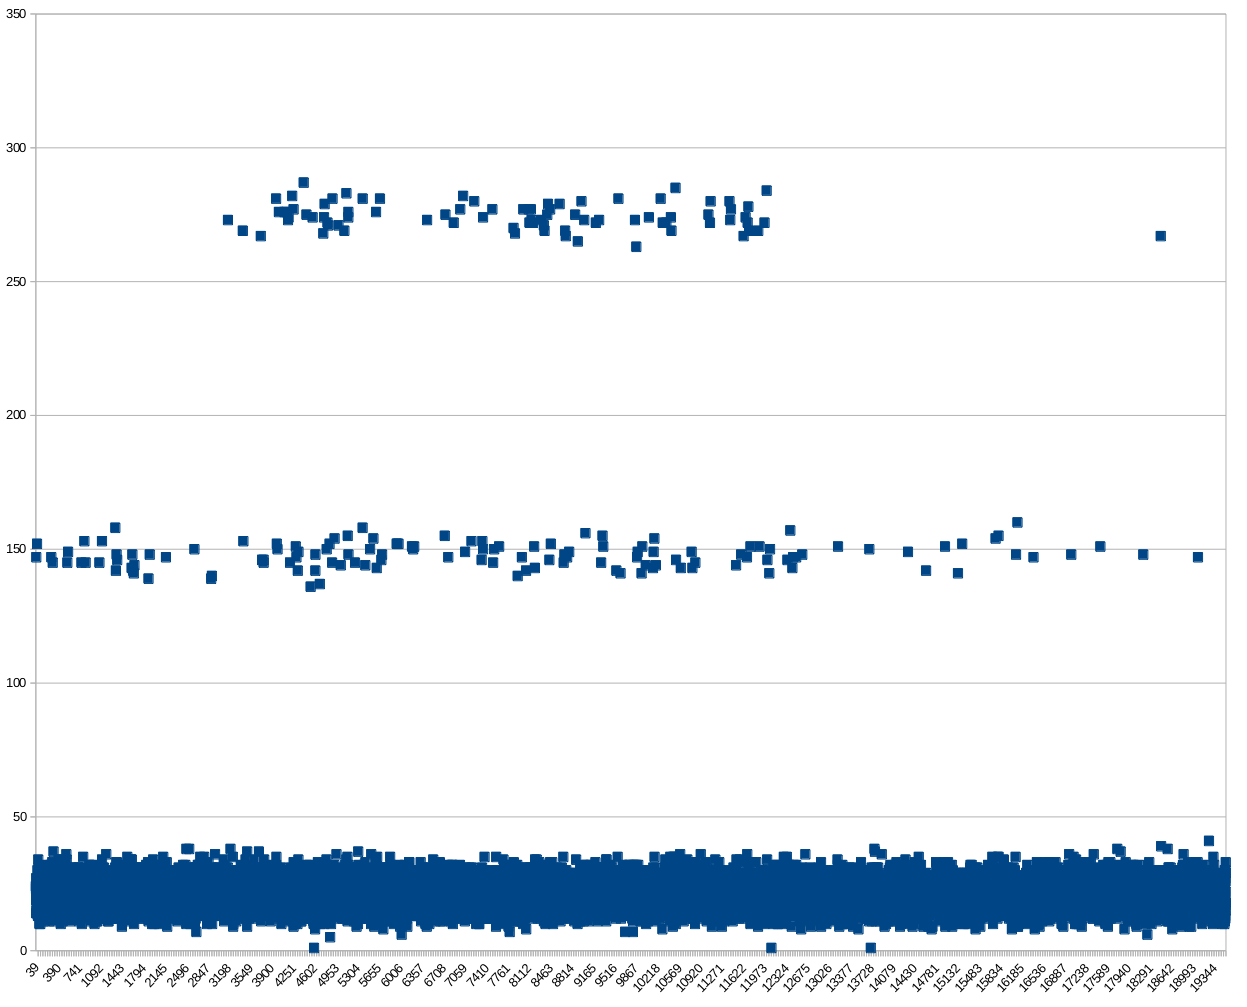
This graph of CPM, most recent to oldest, gives a feel for what I'm asking about.
Image Insert:

53881 bytes |
 |
|
| Reply #2
spot

United Kingdom
7 Posts |
 Posted - 01/21/2018 : 12:24:21 Posted - 01/21/2018 : 12:24:21


|
My first thought was perhaps RAF training flights with forward radar scanners overhead but I think the narrowness of those two bands would be impossible if that were the case.
Problems on the USB lead emulating serial protocol might have corruption but that would never be accepted as a valid data point. I'm sure the bands originate in the GMC-320+V4 itself. And as the earlier URL shows, it's not just mine. |
 |
|
| Reply #3
spot

United Kingdom
7 Posts |
 Posted - 01/21/2018 : 12:59:55 Posted - 01/21/2018 : 12:59:55


|
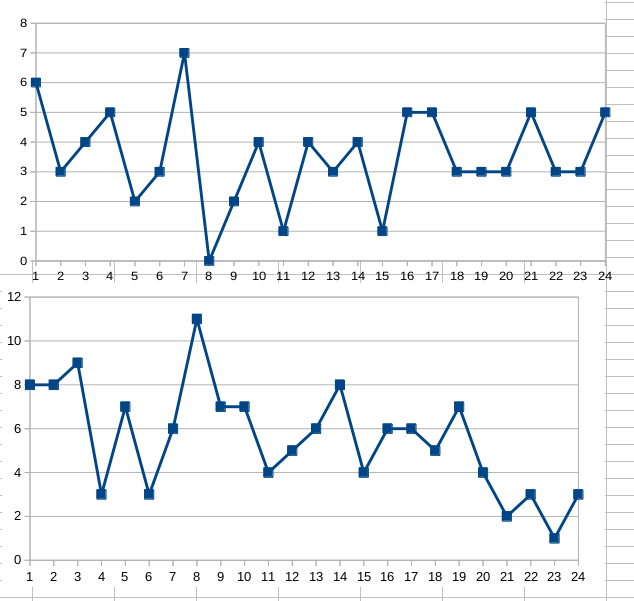
Here's the hour of the day frequency for the two bands, the higher CPM on top and the middle CPM below. I think they're random.
Image Insert:

46867 bytes |
 |
|
| Reply #4
spot

United Kingdom
7 Posts |
 Posted - 01/21/2018 : 13:42:20 Posted - 01/21/2018 : 13:42:20


|
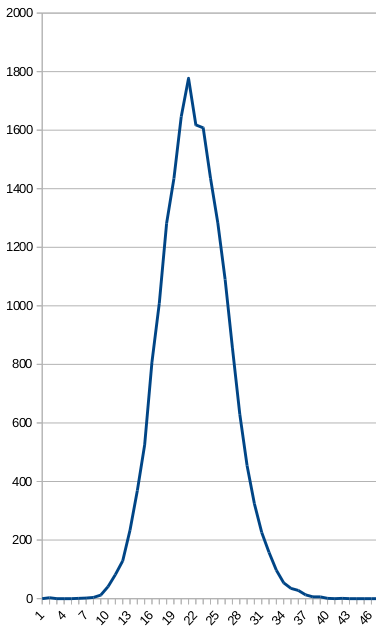
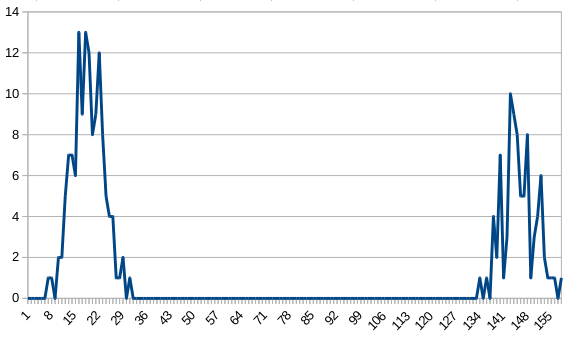
A couple more plots, the top is CPM distribution in the range 0-50 and the bottom is the CPM distribution for the two narrow bands - please add 130 to the x-axis values to get the actual CPM. I think all three distributions are all normal though I'm puzzled by the notch at the top of the first plot.
Image Insert:

22164 bytes
Image Insert:

21423 bytes |
 |
|
| Reply #5
spot

United Kingdom
7 Posts |
 Posted - 01/21/2018 : 17:07:44 Posted - 01/21/2018 : 17:07:44


|
The other detail is that two time periods make up the data. Looking at the first graph, everything to the left of reading 12060 is from the last fifty days. Everything to the right is from September 2016, and while the two sides are different they both show the two narrow high-count bands. I hadn't intended to include the 2016 data but it's interesting that the effect has lasted across the whole 16 months.
The "I'm puzzled by the notch at the top of the first plot" might be related. It's evident that the data shows (at least) two periods differentiated by an average two CPM. Whether that's a result of a shift in the background radiation, or a shift in some other environmental factor which has affected the meter, isn't evident. I'm sure I relocated the meter from a drawer to the tabletop during the intervening period covering the measurements. That could easily be responsible, and seems far more likely than a change in background radiation.
|
 |
|
| Reply #6
ullix
    
Germany
1235 Posts |
 Posted - 01/22/2018 : 01:57:20 Posted - 01/22/2018 : 01:57:20


|
Interesting and puzzling result. These spikes surely do not come from anything real. Likewise those from the other chap you linked to. They are always single offs in a sea of normal background values.
My guess is, it is a software issue, perhaps in the recording software.
Your background is 22, add 128 (=2^7) and you get 150, add 256 (=2^8) and you get 278. These would be single bit flips. The agreement with your data is unlikely just by coincidence.
What software are you using to collect the data?
Can you see these excursions also on the counter or are they visible only on the computer?
Have you downloaded the history from the counter and does it have the same spikes? If so, did you repeat the download and were the spikes at the same position?
|
 |
|
| Reply #7
spot

United Kingdom
7 Posts |
 Posted - 01/23/2018 : 02:16:46 Posted - 01/23/2018 : 02:16:46


|
You're quite right about the 128 data point.
I'd been using the GM Counter Data Logger STD V5.52 unregistered, putting the data straight through to the gmcmap page, so the second-by-second data wasn't visible.
I registered the software yesterday and upgraded to V5.56, and set the radiation alarm to anything over 100. It went off at 4 this morning. The saved csv shows a reading of 128 in the second-by-second breakdown. I presume two of those in the same minute would account for the 256 sum.
I'll ask support to comment in the thread here, or at least express an opinion. |
 |
|
| Reply #8
ZLM
    
1271 Posts |
 Posted - 01/23/2018 : 07:32:47 Posted - 01/23/2018 : 07:32:47


|
The problem could be either from software or tube.
Download the history data in .bin file and check if the spikes exist in raw data.
You can check it yourself or send it to support@gqelectronicsllc.com for verification. |
 |
|
| Reply #9
ullix
    
Germany
1235 Posts |
 Posted - 01/23/2018 : 08:27:50 Posted - 01/23/2018 : 08:27:50


|
I guess "GM Counter Data Logger STD V5.52" is a software from GQ and you are running it on Windows? (I use my own software GeigerLog on Linux, https://sourceforge.net/projects/geigerlog/files/)
I did not understand: where was the alarm set, at the PC or at the counter. Since you mention CSV, I guess it was on the PC? The counter didn't say anything?
Do you get the same spike when you only run the counter, NOT connected to the PC?
As ZLM suggested, download the history from the counter!
|
 |
|
| Reply #10
GER_aki75
 
Germany
18 Posts |
 Posted - 09/20/2018 : 14:54:41 Posted - 09/20/2018 : 14:54:41


|
quote:
Originally posted by spot
Every day a seem to have one or two data spikes between 140-155 CPM, often around the same time of day. I doubt it's triggered naturally. What might it be?
It is probably the time snyc between the device and the software. It is the same with my 320 Plus V4. Everytime the time sync is done the reading is high for one count or one minute.
|
GMC 320 Plus V4
GMC 500 Plus
EMF 390
Geigermap Location: 48.348745928343035,10.899212072585215 |
 |
|
| Reply #11
The Whatnought

USA
1 Posts |
 Posted - 01/26/2023 : 18:14:26 Posted - 01/26/2023 : 18:14:26


|
I've had my GMC-320+v4 since, oh, 2018 or so. Just for fun. I take it when I go on the road or do a show somewhere, mostly in Northern California. Worked fine for a few years and then in 2021 I started to run into this phenomenon. First noticed it in North Lake Tahoe in late summer 2021. Was doing a gig in a hotel on the lake and it was in my bag minding its own business when it would spike 150+ with the alarm going off. On battery, I would reset it and it would be fine for awhile then do it again. Sometimes it will spike to 1000+ cpm. I first thought it was low battery related. Subsequent tests on usb power generated the same results. I had an angiogram at one point and it definitely registered when on my person and faded as I got farther away. Unfortunately I was not able to manifest super powers. But I digress. Been playing with it recently due to all the recent Pacific rain and charging it on my desk in Oakland. It will act normal for a few days and then randomly spike in the middle of the night or day to aforementioned levels and then act normal again for awhile. Brought it with me to work today and it did it several times between downtown Oakland and Hayward. When reset it drops down to reading "normal" background levels like it did when I first got it (15-45 cpm) and then spike again randomly. Sometimes the spikes happen in rapid succession and sometimes days go by with no spikes. Also, when the heavy spikes happen the LED stops blinking. So the 3 possibilities of system aberrations are 1: Something is wrong in the device and it is erroring due to component failure, 2: Something is wrong with the environment and causing weird readings and the device is misreading the input, 3: The device is functioning as it was designed to and we do not know the cause in the environment.
When I have the extra cash I'm thinking of buying another one so I can verify the behavior in real time. Until then I will keep watching the posts to see if this appears with others. Oh yes, percussive testing did not yield any noticeable changes in its behavior. Visual inspection of the circuit board did not show any cold joints or damaged components.
My background cred: I am a lighting designer and systems analyst in the entertainment industry. I have been testing and fixing robotic lighting and electronics regularly for over 20 years and have a fairly good background in analogue electronics and fabrication.
Hope I wasn't too long winded and that maybe some of this info helps. |
 |
|
| Reply #12
EmfDev
    
2374 Posts |
 Posted - 01/30/2023 : 15:56:15 Posted - 01/30/2023 : 15:56:15


|
| Hi The Whatnought, thank you for sharing the information. It may also be the end of the tubes lifespan. You can try to replace the tube yourself or send it to us to check or for service. If you want us to check, please email support with your order number so they can tell you the details and instructions. |
 |
|
| |
 Topic Topic  |
|

