| Author |
 Topic Topic  |
|
|
jbdavi211
 
USA
21 Posts |
 Posted - 08/23/2012 : 17:39:11 Posted - 08/23/2012 : 17:39:11


|
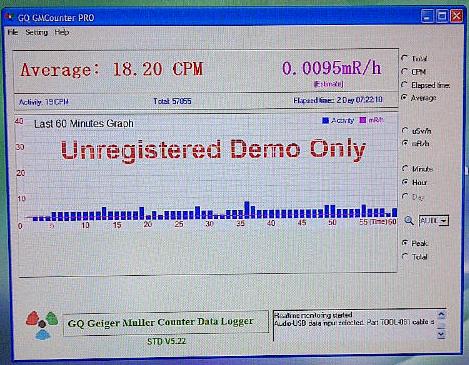
Hello, I have measured the background count here in Portland, OR. USA over the last two weeks. It varies very little, between 14 and 19
Using GMC-080 Kit with a Russian CBM-20 Tube.
What is the background count in your Town? (Put your town in your reply)
J
Image Insert:
56.74 KB |
Edited by - jbdavi211 on 10/04/2012 14:11:15
|
|
| Reply #1
ZLM
    
1271 Posts |
 Posted - 08/23/2012 : 20:11:13 Posted - 08/23/2012 : 20:11:13


|
| it is depending on the tube. My one uses M4011 and the background range is 15-25 CPM here in Seattle,WA. |
 |
|
| Reply #2
simber

7 Posts |
 Posted - 08/24/2012 : 14:04:08 Posted - 08/24/2012 : 14:04:08


|
Image Insert:

32.18áKB
I have taken about 4 days data as shown in the figure. The gray line is count per minute while the red line is its 1-hour simple moving average.
Using GMC-300 with GM tube: M4011.
The average of all these data is 15.1 CMP, in College Park, Maryland.
|
Edited by - simber on 08/24/2012 14:13:00 |
 |
|
| Reply #3
ZLM
    
1271 Posts |
 Posted - 08/24/2012 : 14:29:17 Posted - 08/24/2012 : 14:29:17


|
The data should be right. We always use average CPM as reference. I have not came average CPM in my location yet.
|
 |
|
| Reply #4
jbdavi211
 
USA
21 Posts |
 Posted - 09/21/2012 : 07:36:30 Posted - 09/21/2012 : 07:36:30


|
| Follow up, My data has remained very constant since I posted this. The only difference was when the CME (Coronal Mass Ejection) hit the earth. The background went up for the full day by 5-8 counts per minute. I suppose that isn't really very much, except in the cumulative daily dose. |
 |
|
| Reply #5
and_kom
 
Ukraine
24 Posts |
 Posted - 10/06/2012 : 09:17:05 Posted - 10/06/2012 : 09:17:05


|
| 25-30 CPM in Kharkov, Ukraine |
Young and radioactive |
 |
|
| Reply #6
phgphd
 
USA
12 Posts |
 Posted - 10/06/2012 : 12:19:16 Posted - 10/06/2012 : 12:19:16


|
In Salt Lake City, UT, the count is 10-40 counts per minute. The average is about 20 and that range pretty much covers the average +/- one standard deviation. Mine is the stock GMC-300 with M4011 tube.
One several plane trips I have taken the GMC-300 along. Counts reach 1000-1500 CPM at cruise altitude of 40,000 feet. CPM quickly returns to less than 100 once below 10,000 feet. |
 |
|
| Reply #7
jbdavi211
 
USA
21 Posts |
 Posted - 10/12/2012 : 19:42:58 Posted - 10/12/2012 : 19:42:58


|
and_kom
high due to Chernobyl? how far are you from there? I had a Master-1 dosimeter bought in 1974-ish. I re-purposed the tube to a GMC-080 kit after all those years it is just like new. keep measuring it would be very interesting to have others in different parts of the USA or the world measure and report their background radiation here.
J |
 |
|
| Reply #8
and_kom
 
Ukraine
24 Posts |
 Posted - 10/14/2012 : 02:15:10 Posted - 10/14/2012 : 02:15:10


|
jbdavi211
I don't consider it's high due to Chernobyl (Kharkov is at a distance of 450 km (280 mi) from Chernobyl).
I measured it inside a building (typical soviet tower blocks have higher background radiation due to reinforced concrete). The outside count is 20-25 CPM.
Btw, I am going to visit Chernobyl Zone next weekend. I will write a report after. |
Young and radioactive |
Edited by - and_kom on 10/14/2012 02:25:44 |
 |
|
| Reply #9
and_kom
 
Ukraine
24 Posts |
 Posted - 11/09/2012 : 05:40:40 Posted - 11/09/2012 : 05:40:40


|
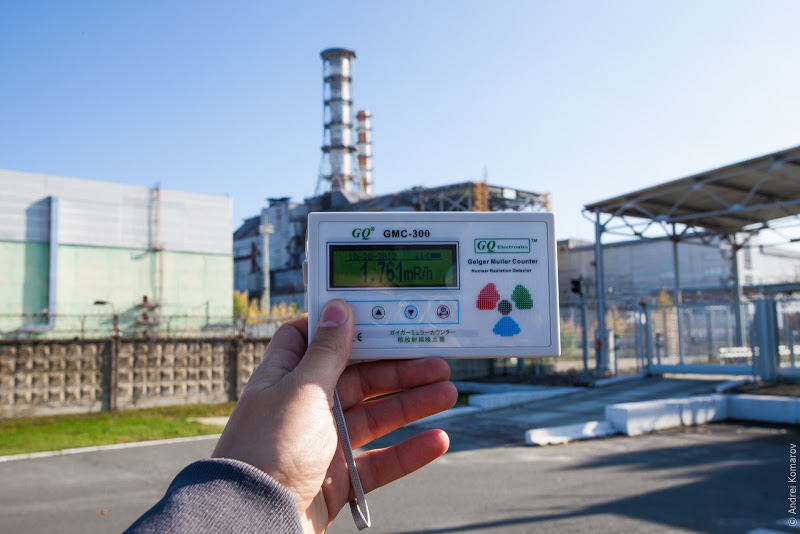
Here is a little report after Chernobyl Exclusion Zone trip:
Chernobyl - 0.15 uSv/h
Road across the "Red Forest" - 10 uSv/h
The "Bridge of Death" - 10 uSv/h
Pripyat - 0.70-1.5 uSv/h
CHNPP's Reactor #4 sightseeing spot - 17 uSv/h
Some radioactive spots - up to 2 mSv/h
Image Insert:
98.55áKB |
Young and radioactive |
Edited by - and_kom on 11/09/2012 06:09:10 |
 |
|
| Reply #10
jbdavi211
 
USA
21 Posts |
 Posted - 11/09/2012 : 16:48:48 Posted - 11/09/2012 : 16:48:48


|
and_kom
This is fantastic, GREAT job on reporting yours and Chernobyl's background radiation count.
I just wish more people around the world would also carry this thread onward with reports from their areas of the world.
So anyone who reads this please reply with your count.
remember it doesn't have to be a in-depth study just a count where you live.
Thanks
J |
Edited by - jbdavi211 on 11/09/2012 16:49:38 |
 |
|
| Reply #11
ZLM
    
1271 Posts |
 Posted - 11/15/2012 : 15:13:34 Posted - 11/15/2012 : 15:13:34


|
and_kom, thank you for sharing those information.
Good picture!
|
 |
|
| Reply #12
bifferidge
  
USA
34 Posts |
 Posted - 12/23/2012 : 17:41:06 Posted - 12/23/2012 : 17:41:06


|
| Does the GMC300 have a way of just displaying uSv/hr? |
 |
|
| Reply #13
ZLM
    
1271 Posts |
|
| Reply #14
bifferidge
  
USA
34 Posts |
 Posted - 12/25/2012 : 20:04:28 Posted - 12/25/2012 : 20:04:28


|
fantastic, thanks.
By the way, nice picture @ ChNPP - - when's the shelter object being installed - next year? |
 |
|
| Reply #15
and_kom
 
Ukraine
24 Posts |
|
| Reply #16
bifferidge
  
USA
34 Posts |
 Posted - 01/06/2013 : 13:45:09 Posted - 01/06/2013 : 13:45:09


|
quote:
Originally posted by ZLM
sure. It is a selectable feature. You can select CPM, uSv/h, mR/h.
See SOFT GMC-300 Demo:
http://www.gqelectronicsllc.com/downloads/download.asp?DownloadID=54
Hi - so I ran the demo but couldn't get it to do what I wanted. Is there anyway to have uSv/hr instead of CPM on the main screen AND still get the graphical display? |
 |
|
| Reply #17
ZLM
    
1271 Posts |
 Posted - 01/07/2013 : 10:41:27 Posted - 01/07/2013 : 10:41:27


|
| No. If in GMC-300 graphical display mode, then the current CPM is displayed on the top. The current firmware has no option to change the CPM to others. |
 |
|
| Reply #18
icetraigh

USA
4 Posts |
 Posted - 02/01/2013 : 11:45:35 Posted - 02/01/2013 : 11:45:35


|
| Hi! GMC-300 in Marion, Ohio here. I get consistent readings of about 0.1 uSv/h all over town. Range is 0.05 to 0.15 at the most. Looks like we're in good shape radiation-wise. |
Edited by - icetraigh on 02/01/2013 11:46:15 |
 |
|
| Reply #19
jimehall2

USA
2 Posts |
 Posted - 02/02/2013 : 12:44:15 Posted - 02/02/2013 : 12:44:15


|
| There is a web site www.radiationnetwork.com that has real time background counts for many areas in the USA and around the world. |
 |
|
| Reply #20
icetraigh

USA
4 Posts |
 Posted - 02/12/2013 : 08:36:59 Posted - 02/12/2013 : 08:36:59


|
quote:
Originally posted by jimehall2
There is a web site www.radiationnetwork.com that has real time background counts for many areas in the USA and around the world.
Cool map! I see you use CPM. Should I be looking at that instead of uSv/h? Can you get a higher CPM without recording a high uSv/h? |
 |
|
| Reply #21
bifferidge
  
USA
34 Posts |
|
| Reply #22
jbdavi211
 
USA
21 Posts |
 Posted - 03/04/2013 : 01:02:51 Posted - 03/04/2013 : 01:02:51


|
Update on background count in Portland, OR. USA
No real change on the count, very steady day after day.
Watching for any change in the background count due to N. Korea testing or Fukushima disaster setbacks.
The site "www.radiationnetwork.com" is a great site. I am unable to purchase their software for around $75.00 to be able to read their map with any zoom in.
There is a group that is attempting to start a distributed computing data site via the BOINC (Berkley open infrastructure network computing) like WorldCommunityGrid or the most well known "SETI@Home".
I am waiting to join that group once they have support for the GQ counters (what this site is providing). Once they get that available I will be on board.
What I would really love to see is more people around the world replying to this thread with the radiation background count at their locations.
Thanks
J |
 |
|
| Reply #23
ZLM
    
1271 Posts |
 Posted - 03/04/2013 : 13:18:51 Posted - 03/04/2013 : 13:18:51


|
There is another network supports GQ-200 and GMC-300 geiger counter.
See: www.netc.com
|
 |
|
| Reply #24
DrugDoc

USA
3 Posts |
 Posted - 03/05/2013 : 05:18:31 Posted - 03/05/2013 : 05:18:31


|
| This may be a stupid question, but....When you're just reporting CPM's, what is the KEV threshold and/or range that is being monitored? We monitor our background level mainly with a SCA set to look for anything above 50 kev, and comparatively, most of the numbers posted here seem low. Is that simply due to the lower sensitivity of the G-M tube when compared to the SCA's chrystal scintillation detector? |
 |
|
| Reply #25
jbdavi211
 
USA
21 Posts |
 Posted - 03/13/2013 : 18:54:43 Posted - 03/13/2013 : 18:54:43


|
| I don't think that KEV measurement is available with the "counters" that we are using. The software converts the CPM to mSv/s or mR/n. These measurements are at fairly accurate and a baseline to the local condition. Portland, OR. USA is a pretty low count even though we are fairly close to Hanford to the north. (close as in relative sense). By the way isn't 50 KEV = 50 Thousand Electron Volts? ( www.rapidtables.com/convert/energy/kev-to-ev.htm Other cool conversions on this page also ) Placed my counter on the NETC.com site this will be good as you can also see a lot of sites in the USA. Thanks for the lead to that monitoring site. |
Edited by - jbdavi211 on 03/13/2013 19:45:46 |
 |
|
| Reply #26
DrugDoc

USA
3 Posts |
 Posted - 03/20/2013 : 07:22:28 Posted - 03/20/2013 : 07:22:28


|
I realize keV measurement isn't a part of the information gained from these counters, I was simply wondering what their keV "threshold" was. (the energy level at which they recognize a Desintigration, and start counting) For example, I believe Ludlum Model 14C GM meters have a threshold of 60keV (and yes, I wasn't paying attention to my syntax in my previous post. 50 keV, which is what I intended = 50/1000 of an electron volt.)
That being said, a Ludlum 14C with model 44-9 pancake probe might give a background reading average of 25-30cpm in our lab, while a Ludlum 2200 SCA with the same threshold setting might give a background of 375-400cpm for the same time period, in the same location, due to the increased sensetivity of the SCA's crystal scintillation detector over the gas filled probe of the GM meter. I was just wondering if anyone knew the threshold for these GMC-200's? Are they comparable to a standard GM meter such as a Ludlum 177 or 14C?
As to how accurate they really are, I don't follow your satement " These measurements are at fairly accurate and a baseline to the local condition." Is that in comparison to another type of meter? Or based on calculations done with readings obtained using said GMC meter and one or more sources such as Co-57 or Cs-137? |
 |
|
| Reply #27
jbdavi211
 
USA
21 Posts |
 Posted - 03/26/2013 : 11:06:02 Posted - 03/26/2013 : 11:06:02


|
Hello again
what I meant when I said: "These measurements are at fairly accurate and a baseline to the local condition." I had tested the counter using a test sample that I have. see link (gqelectronicsllc.com/forum/topic.asp?TOPIC_ID=3634) "50s era test sample" which shows the counter is pretty accurate in the readings that it samples.
You also can go to this site " netc.com " and see my Portland, OR USA measurements that are being taken on an (I believe) average of 10 minute increments. Lots of other measuring local sites also.
I really enjoy being a part of this type of "Old Wild West" data measurement and recording for the public to be able to see what is happening in the world.
don't forget to check out some other distributed computing projects such as Quake Catcher Network " qcn.stanford.edu ".
Take part in these sort of projects to help monitor what is happening in the world.
Thanks (off the soap box now)
J |
 |
|
| Reply #28
Mr. James

USA
1 Posts |
 Posted - 11/15/2013 : 11:41:21 Posted - 11/15/2013 : 11:41:21


|
At Stanford University in Palo Alto, California - using a GQ GMC-300E:
CPM: 15 and 0.09 - 0.15 uSv/h
Would everyone agree that this is normal background for this area?
|
Mr. James |
 |
|
| Reply #29
NoFracking

3 Posts |
 Posted - 01/30/2014 : 19:02:14 Posted - 01/30/2014 : 19:02:14


|
Livingston County, Michigan GQ-GMC-320 CPM 7-29 over the last few days
|
 |
|
| Reply #30
Nev

United Kingdom
1 Posts |
 Posted - 02/02/2014 : 03:24:04 Posted - 02/02/2014 : 03:24:04


|
Hi
I live Near Southampton in southern England.
I've just taken a reading from my back door using my gmc300 and I'm getting .09 uSv/H or 18 CPM as background radiation.
Best wishes
nev |
Edited by - Nev on 02/03/2014 14:12:01 |
 |
|
| Reply #31
edo

1 Posts |
 Posted - 04/29/2014 : 09:44:52 Posted - 04/29/2014 : 09:44:52


|
| Great thread. I live about 2 miles (not down wind) from the defunct Eureka CA nuke plant, which has its core buried in a concrete cask on site. Readings on my GMC300E+ with M4011 tube are 20cpm at the plant, 20cpm at my house, and 20cpm just about everywhere else in the area including on the beach with 3 to 4' Pacific ocean waves breaking and atomizing spray. And it seems like everyone around the world with this same geiger counter is getting similar readings. The nuke plant is required to run a monitor and it averages around 160 cpm with a high of about 250cpm (from NETC). It was posting 162cpm the day I took my reading of 20cpm. I am assuming this huge difference in readings is a function of the plant's monitor, which I believe mechanically pumps air over its tube. Does anyone have another explanation for this big difference? Thanks |
 |
|
| Reply #32
Alchemy2
   
Canada
89 Posts |
 Posted - 05/29/2014 : 12:03:51 Posted - 05/29/2014 : 12:03:51


|
| Just got my GMC-320 Plus, and it reads around 14-22CPM typically, or 0.08-0.11uSv/h. Winnipeg, MB Canada. |
The more I learn, the more I realize I do not know! |
 |
|
| Reply #33
didyouhearthat

Australia
5 Posts |
 Posted - 06/14/2014 : 02:03:00 Posted - 06/14/2014 : 02:03:00


|
Here in Central Victoria in Australia i get around 16 to 20cpm indoors. 0.09uS/h
|
 |
|
| Reply #34
Alchemy2
   
Canada
89 Posts |
 Posted - 06/22/2014 : 23:50:56 Posted - 06/22/2014 : 23:50:56


|
Hi there...
Sorry for the late reply, but I just joined about 3 weeks ago. I suspect that the reading differences between your unit and the plant site are mainly due to distance to source. I assume that you're outside the main core area, and that would be monitored using a GM or similar detector in the core.
You're probably outside the fence line. The fact that you got 20CPM is good... It means the shielding is intact and doing its job.
FYI, I went to the AEC Whiteshell facility in Pinawa MB Canada a few weeks back just after getting this unit. They decommissioned a test reactor about 25 years ago, and only the electron accelerator and R&D labs remain. No elevated levels (similar to your results, about 20CPM or around 0.12uSv/h), and pretty much the same in the buildings n site too, so their reclamation of the site was very good.
Darren
quote:
Originally posted by edo
Great thread. I live about 2 miles (not down wind) from the defunct Eureka CA nuke plant, which has its core buried in a concrete cask on site. Readings on my GMC300E+ with M4011 tube are 20cpm at the plant, 20cpm at my house, and 20cpm just about everywhere else in the area including on the beach with 3 to 4' Pacific ocean waves breaking and atomizing spray. And it seems like everyone around the world with this same geiger counter is getting similar readings. The nuke plant is required to run a monitor and it averages around 160 cpm with a high of about 250cpm (from NETC). It was posting 162cpm the day I took my reading of 20cpm. I am assuming this huge difference in readings is a function of the plant's monitor, which I believe mechanically pumps air over its tube. Does anyone have another explanation for this big difference? Thanks
|
The more I learn, the more I realize I do not know! |
 |
|
| Reply #35
Setagaya-Observer

7 Posts |
 Posted - 09/07/2014 : 07:16:47 Posted - 09/07/2014 : 07:16:47


|
Setagaya/ Tokyo: in average ca. 0.10 micro-Sievert/ Hour
on dry Soil. (in September 2014)
I use different Geiger-Counter while i am "on the Road"
through Japan.
Fukushima-Daiichi cause/d a lot of environmental and social Problems
but "the Hot Zone" itself is relative small.
There are a few Hot Spots very close to Tokyo like in Tochigi or Kashiwa
(for example)
but usually we are well informed about the Locations try to avoid
this Places.
I think that the Japanese People own the majority of Geiger-Counter,
there are afaik no actual Numbers but it must be a lot!
We should think at least twice before we continuing to use ole/
very old Nuclear Power Stations,
i doubt that we have that much Luck (like in Fukushima) again |
 |
|
| Reply #36
jbdavi211
 
USA
21 Posts |
 Posted - 09/30/2014 : 15:08:25 Posted - 09/30/2014 : 15:08:25


|
| It appears that this thread is wildly successful beyond my meager expectations. We all are very interested in the background radiation levels around the globe, most assuredly since the tragedy at Fukishima. I would hope that everyone that reads this thread and has a counter/meter of any kind would reply with their count/reading. I am also participating with the NETC dot com (Nuclear Emergency Tracking Center)which shows reading around the globe also. . I would forward a small challenge to get your counter online so we can see in REAL-TIME levels across the world. Thank you all for your participation with this thread and hopefully the NETC dot com site. Lets watch and measure for the good of us all. |
Edited by - jbdavi211 on 09/30/2014 15:21:28 |
 |
|
| Reply #37
madmikeg

USA
5 Posts |
 Posted - 10/02/2014 : 19:51:39 Posted - 10/02/2014 : 19:51:39


|
Readings taken with GMC 320+ between April and September 2014
Home Near Raleigh NC: Avg. 17CPM ranges between 6-35 most days.
Near Norfolk, VA: Avg 14CPM ranged between 5-30
Driving near Danville VA: Certain areas would reach 40-50CPM I've driven through the same area multiple times and have produced the same results. There are known to be significant uranium deposits in this area so I'm convinced this is natural.
|
Edited by - madmikeg on 10/03/2014 05:58:44 |
 |
|
| Reply #38
gordy

6 Posts |
 Posted - 10/13/2014 : 18:48:57 Posted - 10/13/2014 : 18:48:57


|
Dawson Creek BC Canada seemed to be 20-30-cpm had a high of 54cpm one day.
Grande Prairie AB Canada seems to range 16-25cpm
|
 |
|
| Reply #39
gordy

6 Posts |
 Posted - 10/25/2014 : 19:04:10 Posted - 10/25/2014 : 19:04:10


|
interesting results, I think any ways
flying over Alberta @ 25000 feet highest reading 150cpm
flying Alberta to Vancouver BC @38000 feet highest reading 406 cpm
and going thru the xray machine for security 14816 cpm |
 |
|
| Reply #40
Craig
 
USA
22 Posts |
 Posted - 02/01/2015 : 14:20:01 Posted - 02/01/2015 : 14:20:01


|
Here's my most recent bar graphed results:
> h**p://radviews.com/station-history/?station_id=137
--which I also line graph as percentages of my baseline, per:
> h**p://radviews.com/upload/1421898939417437416.gif
--all of which and more you can access via:
> h**p://radviews.com/map/ (** = tt)
* Those of you interested in doing networked monitoring are invited to join us (for free) and to post at RadViews.
This networking group does not require you to be continuously on-line, to purchase anything (except your own Geiger counter), to make graphs/scriptnalyses, nor (thanks to the new GMC-320-v4) even to have your computer running (except to post your results), or to trench a cable to your outside station^.
* Although RadViews gives you the option of posting in CPM, I suggest posting in _averaged^_ uSv/hr, which helps us all to be "on the same page" numbers-wise, and to take in RadViews map's graphs at a glance.
^ Average for at least 10 minutes, and the GMC-320 will do that for you --over any period. My averages are about 12 hours long (from my outside station), but with out-of-bounds (209+%) peaks noted. (The GMC-320 will data-log for over a year[!] to help you recover and document peaks.)
^ *** If you place any Geiger counter in an outside shelter/bird house, seal it into a Ziploc baggie with a packet of fresh desiccant. By replacing the comes-with 800mah lithium battery with an 1800mah to 2500mah (same physical size) battery, you need only bring your GMC-320-v4 back in to be recharged once a week.
* I'm converting M4011 clicks at the rate of 16.00cpm = 0.10uSv/hr (and the 320 lets you set that to be its calibration), but if you or your software have been using (say) 20cpm = 0.10uSv/hr, fine --just stick with it so your data/postings are consistent.
(And "ZLM" should chime in and correct anything I might have gotten wrong here about the new 320v4.) |
 |
|
| Reply #41
seltech

USA
4 Posts |
 Posted - 03/06/2015 : 09:38:17 Posted - 03/06/2015 : 09:38:17


|
| seeing 18-30 CPM in Portland Maine |
 |
|
| Reply #42
NRFneversail
 
USA
22 Posts |
 Posted - 03/10/2015 : 13:17:28 Posted - 03/10/2015 : 13:17:28


|
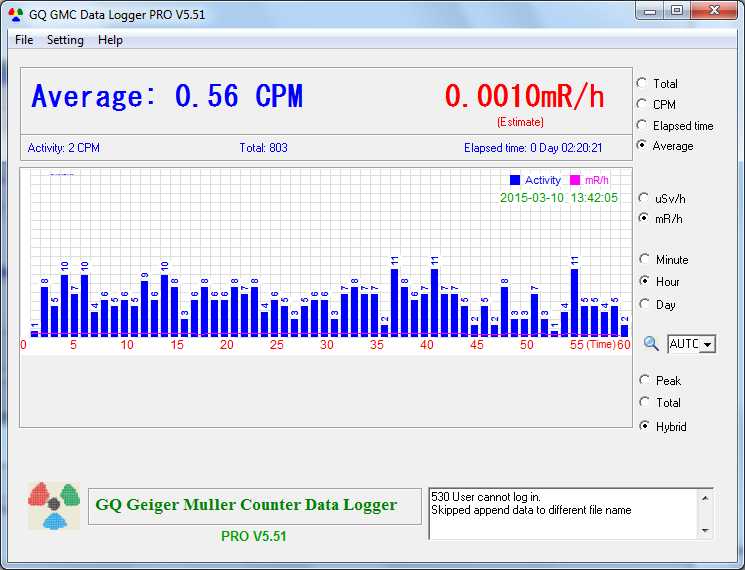
GMC-080 with a US Navy-6107 Beta-Gamma tube. 1 to 11 CPM in a one hour span today. Location is near Lucile Idaho along the Salmon River. No radioactive Salmon or Steelhead fish yet. Javascript:insertsmilie(' ') ')
Last Fall during all the sun activity, I was getting anywhere from a normal 0-9 CPM to up around a 100 to 150 CPM and at times around 200+ Gamma (shielded Beta). This was occurring here at 1568 ft. elevation in West Central Idaho and at 5290 ft. the northern South East Idaho. Sure wish I had kept some of those graphs.
Image Insert:
59.59áKB   |
Edited by - NRFneversail on 03/10/2015 13:26:59 |
 |
|
| Reply #43
ZLM
    
1271 Posts |
 Posted - 03/10/2015 : 23:45:44 Posted - 03/10/2015 : 23:45:44


|
| Average is 0.56? it seems the unit has been disconnected for a period. From graph I can see the average should be around 5.6 |
 |
|
| Reply #44
NRFneversail
 
USA
22 Posts |
 Posted - 03/11/2015 : 16:26:20 Posted - 03/11/2015 : 16:26:20


|
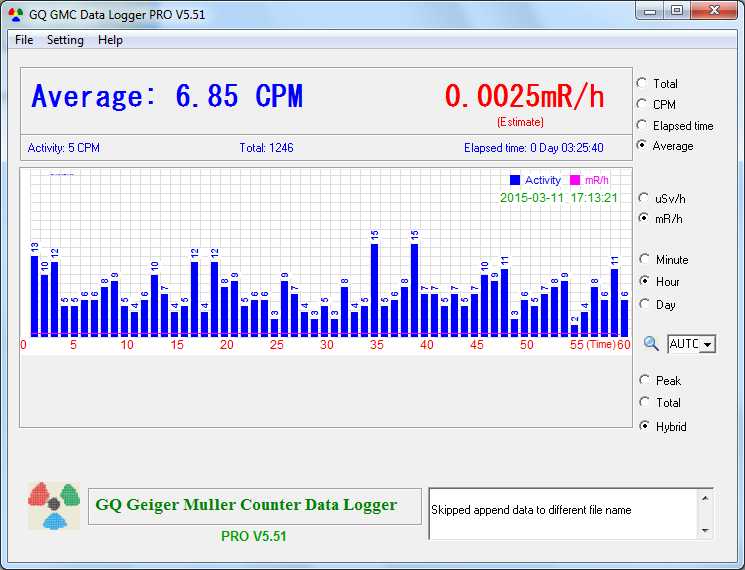
That is correct, I have had it off-line now and then and it was set for a 24 hour CPM average it never saw. Here it is now set for a one hour CPM average.
The weather coming in from the west coast still at this time has not produced any rain here in the canyon and is 58 degrees, cloudy, with a breeze.
Image Insert:
59.91 KB |
 |
|
| Reply #45
SUB750T
 
Canada
17 Posts |
 Posted - 04/08/2015 : 16:26:37 Posted - 04/08/2015 : 16:26:37


|
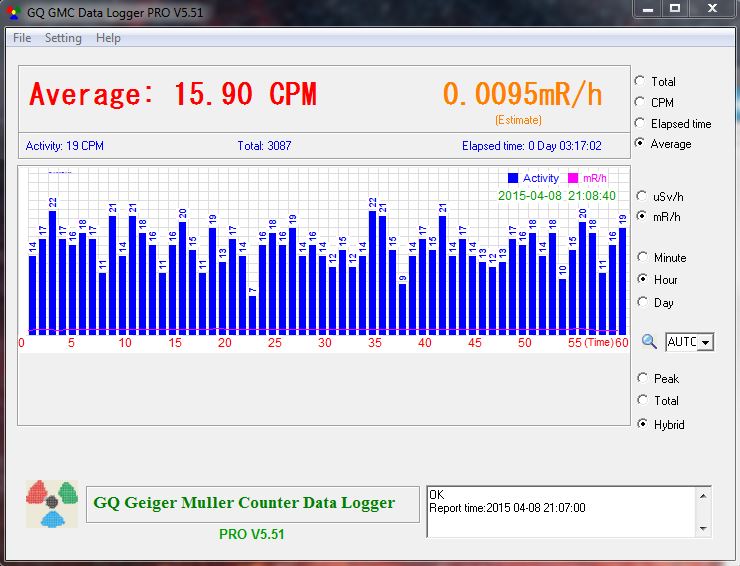
15.9 CPM. I'm 50 Miles within three Nuclear Power Plants (Total of 18 reactors or 13000 MW) Brampton, Ontario
Unit: GMC-320 + v4
Tube: M4011 (will upgrade to SBM-20 soon)
Image Insert:
93.47áKB |
Edited by - SUB750T on 04/08/2015 17:10:38 |
 |
|
| Reply #46
Nudnik
  
40 Posts |
 Posted - 04/09/2015 : 23:49:55 Posted - 04/09/2015 : 23:49:55


|
16-17cpm (~80-85nSv/h) on 24h average.
N47.84
E13.08
AUSTRIA - Salzburg |
under construction |
 |
|
| Reply #47
lylo

Canada
2 Posts |
 Posted - 04/29/2015 : 19:26:32 Posted - 04/29/2015 : 19:26:32


|
These small geiger tubes are inherently noisy, which is in fact their major limitation. For that reason, cpm's taken over a minute, which is what I assume is on the maps and what many seem to be reporting here, are fairly meaningless if you are trying to distinguish say 12 from 20 over a short time frame. For the same radiation environment, you could get a reading of 6 cpm, 11 or even 20 and they'd all be "true", that is, not really different from each other in a meaningful way. This is known as random error, aka precision. You should really count over say 10 hours and divide by 600 to get a cpm that is then good (reproducible) to one or two cpm's. (That's a little bit of oversimplification, but at least it skips over the standard deviation discussion). The other way to reduce noise is to capture more events, and that means using a bigger geometry tube such as a pancake gm tube, hooking up a bunch of tubes in parallel, counting over a longer period, or going to a scintillation arrangement. That way, you can get your counts to settle down without having to wait 10 hours or more. Speaking of that, I am a bit disappointed in my GMC-300 that it's firmware doesn't do a long (say 10 or 24 hour) count and then divide by time to get cpm, or even better, keep a running average that would gradually regress to the mean over time. You might say, "what? I have to count for a whole day to get a decent number? But I want to know if the background radiation was to increase by say 10 or 20% right away, meaning after a few minutes, like if a Fukushima type cloud blew in, or a solar flare. Or that my reading of 25 cpm's indicates actual inherently higher background than my neighbour's 20 cpm". Well, the short answer is, for such relatively small changes, you can't--unless you get more counts somehow, as above. Fundamentally, if the number of counts is N, the noise is square root of N. The more counting events, the quicker it settles down to a real mean, although after a while, the marginal improvement diminishes. Having only 20 or so cpm's to start with means a long count period if you want the difference between 20 and 22 cpm's say, to be meaningful. That's why GM's are often said to be better regarded as almost qualitative (as in, yes, there is radiation here) than quantitative (as in, 22 is significantly different from 20) instruments. The plane ride graphic is a good example where it does well, because the environments are so different, the big change shows up well. Same would be true if you were in a double triple or 100x background environment like Fukushima, these little GM's are great for that. But if I want to look for an smallish increase due to solar flares say, over a short time frame, I should expect it to be quite challenging to identify with low end equipment. I don't mean to criticize the GQ stuff--I love mine and think it is a quite an amazing value for what it does and costs and a great way to get started--I just want people to know that just like every measuring instrument, it has built in limitations (due to the size/sensitivity of the GM tube) and you need to be aware of them or you will mislead yourself, and potentially others as well. If I sound a tad pedantic, well, I am retired now but I taught this stuff (passionately!) in my Chem and Phys classes for many years. As I used to drill into my poor students, you never report a measured number without also reporting the error, i.e. the +-. Because the error is equal in importance to the measured number, and radioactive decay is a great illustration of that principle.
That being said, I get 21 +- 1 cpm indoors here in southern BC Canada (over 24 hours) on my GMC-300 which is factory calibrated to 0.1 uSv, which seems about right. |
 |
|
| Reply #48
PrincessLuna
 
Australia
10 Posts |
 Posted - 05/01/2015 : 00:54:31 Posted - 05/01/2015 : 00:54:31


|
| 20-35 CPM average with m4011 tube, Melbourne, Australia. |
 |
|
| Reply #49
Stibnut

USA
2 Posts |
 Posted - 05/02/2015 : 13:37:26 Posted - 05/02/2015 : 13:37:26


|
I'm in Decatur, Illinois and have a GMC-320. I've done a number of averages over multi-hour periods; they're usually 15.5-16.0 CPM and do not vary much. You definitely have to do a long (at least 1 hour) count to get results that are consistent with each other to within ~1 cpm though. The number that appears on the display can vary from about 6 to about 32 CPM by random fluctuations alone.
I've tried shielding it with several layers (each about 3 mm thick) of lead sheet, but this only drops the average by about 1 CPM. Not sure if most background radiation is coming from high-energy cosmic rays that can easily punch through 1-1.5 cm of lead, radon and its decay products which diffuse inside the lead sheeting, or what. |
Edited by - Stibnut on 05/02/2015 13:39:36 |
 |
|
| Reply #50
Nudnik
  
40 Posts |
 Posted - 05/21/2015 : 02:20:19 Posted - 05/21/2015 : 02:20:19


|
The M4011 tube has a zero count rate of 12cpm. That means, even if there would be no radiation at all, the tube would trigger 12 counts?
Has this been taken into account by the firmware?
Specification:
Both beta and gamma radiation detetion.
Working Voltage: 380-450V
Working Current: 0,015-0,02 mA
Sensivity to Gamma Radiation: 0.1 MeV
Own Background: 0,2 Pulses/s
Working Temperature Range: -50 +60 #1057;
Length: 88mm
Diameter: 10mm |
under construction |
 |
|
| Reply #51
NaCl

Thailand
5 Posts |
 Posted - 08/07/2015 : 02:15:01 Posted - 08/07/2015 : 02:15:01


|
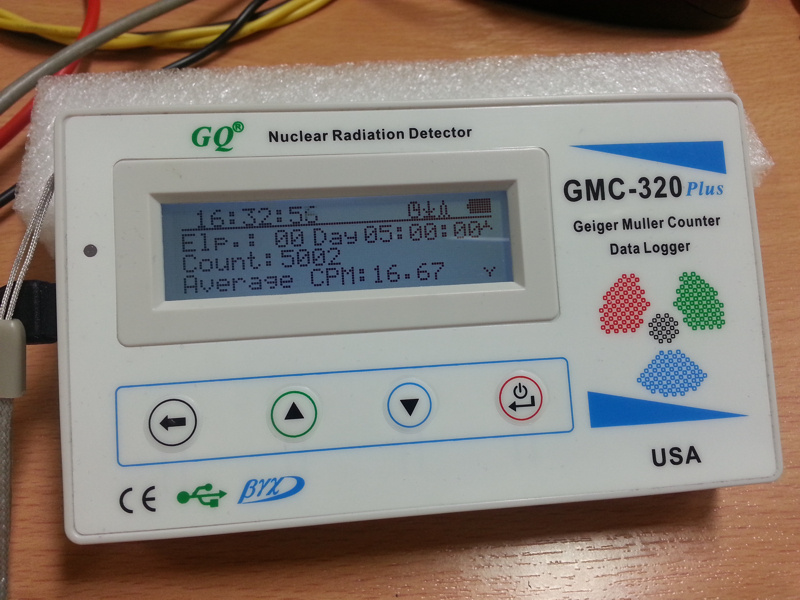
Location: 13.775408,100.542795
Bangkok Thailand avarage 5hr = 16.67CPM
Image Insert:
190.32 KB
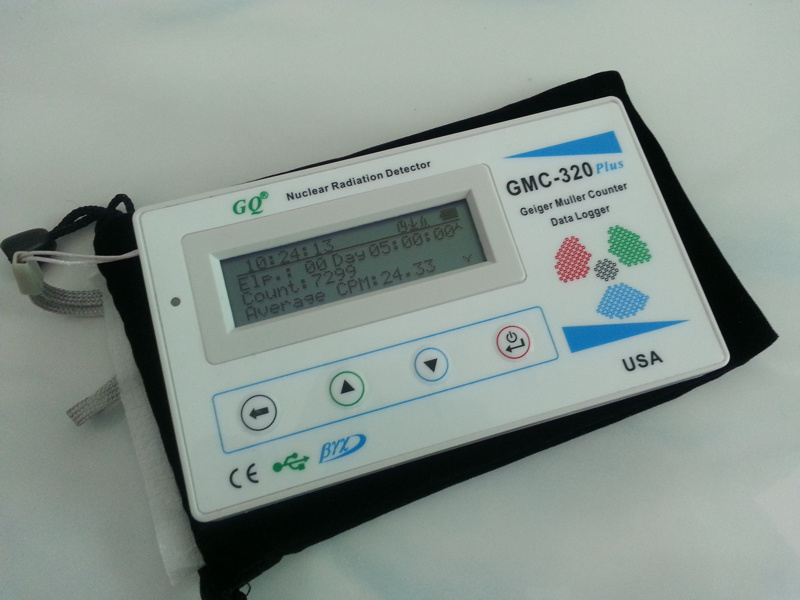
Location: 13.863694, 100.510081
Nonthaburi Thailand avarage 5hr = 24.33CPM
Image Insert:
150.96 KB |
\^L^/
_/|\_ |
Edited by - NaCl on 08/07/2015 02:43:22 |
 |
|
| Reply #52
jbdavi211
 
USA
21 Posts |
 Posted - 12/16/2015 : 04:14:33 Posted - 12/16/2015 : 04:14:33


|
Hello everyone, The response is overwhelming, THANK YOU ALL, interesting observation I had with a pretty heavy rainstorm over the last week here in the Northwest USA Portland was the background count went up to around 30cpm for the four days of the heavy rain. Then returned to the normal of 14-17cpm, Interesting to say the least, however maybe as one writer said , noise? I don't know I continue to monitor and observe.
Again thank you for making this thread the most popular on this forum. KEEP REPORTING your count
Thanks
J |
 |
|
| Reply #53
Distelzombie
    
Germany
202 Posts |
 Posted - 12/16/2015 : 07:44:39 Posted - 12/16/2015 : 07:44:39


|
| are the average ySv/h working on your devices in a timed count? Mine just shows the measured ySv/h right now. |
GMC-300E+ V4.20 with sbt-11a alpha tube
My statements are "stuff-a-hobbyist-says" and not in any way professional. |
 |
|
| Reply #54
GBG12
    
Canada
103 Posts |
|
| Reply #55
jbdavi211
 
USA
21 Posts |
 Posted - 01/01/2016 : 08:26:41 Posted - 01/01/2016 : 08:26:41


|
Just to clarify, my counts are from almost a year (or more) of constant measurements. Also during the rain I was talking about, it was a cold front that came from the Northwest, then after about a week we had another rain storm that came from the Southwest, this storm did not result in an increased count. Interesting to say the least, No idea as to why the difference. I have my counter on NETC dot Com. Pretty easy to see my count as it is one of only about three online counters in the Portland, OR area.
As I said , the response and viewing of this thread is overwhelming as I didn't think there would be quite so much interest. That said, keep reporting as it becomes more interesting as the days, weeks and months go on.
J |
 |
|
| Reply #56
GBG12
    
Canada
103 Posts |
 Posted - 01/02/2016 : 22:36:05 Posted - 01/02/2016 : 22:36:05


|
Hi J
The closest station to Portland I can see on the Netc.com site is in Tualatin OR. Is this yours? This and the 2 nearest private stations I see today don't seem to have a higher count near mid December. Is your data not visible on the Netc graph? I suppose you may have disconnected it and taken separate outside readings?
[My Netc station is the one in Toronto Canada] |
Edited by - GBG12 on 01/02/2016 22:41:09 |
 |
|
| Reply #57
jbdavi211
 
USA
21 Posts |
 Posted - 01/06/2016 : 02:34:54 Posted - 01/06/2016 : 02:34:54


|
| I don't think that the register/graph is available for outside viewing, as I haven't a paid subscription however I may this week or next pay so it is available. (I think, don't know for sure)also sometimes my computer that is monitoring also does my security video and i have been having some problems as I moved it to a laptop from an IBM xServer (difference of 1400watts to 28watts power consumption)just didn't need that powerhouse of computing power for the little usage. I will set up the monitor for when the system goes down again. Happy Monitoring |
 |
|
| Reply #58
Distelzombie
    
Germany
202 Posts |
 Posted - 01/10/2016 : 08:07:55 Posted - 01/10/2016 : 08:07:55


|
quote:
Originally posted by jbdavi211
(1400watts to 28watts power consumption)just didn't need that powerhouse of computing power for the little usage.
Note that a max. 1400W server uses just a fraction of this power under little stress. Servers are pretty economic. But it wont top the 28W of the laptop, though. |
GMC-300E+ V4.20 with sbt-11a alpha tube
My statements are "stuff-a-hobbyist-says" and not in any way professional. |
 |
|
| Reply #59
Exeter

7 Posts |
 Posted - 06/02/2016 : 20:59:56 Posted - 06/02/2016 : 20:59:56


|
Hello, I'm getting .11uSv/h regularly in Coeur d' Alene, Idaho.
Is that a dangerous amount of radiation to be exposed to / all the time ?
Thank-you for any help. Much appreciated.
Sincerely,
Exeter |
 |
|
| Reply #60
Petrovski
 
Netherlands
16 Posts |
 Posted - 06/04/2016 : 02:46:33 Posted - 06/04/2016 : 02:46:33


|
quote:
Originally posted by Exeter
Hello, I'm getting .11uSv/h regularly in Coeur d' Alene, Idaho.
Is that a dangerous amount of radiation to be exposed to / all the time ?
Thank-you for any help. Much appreciated.
Sincerely,
Exeter
0.11 uSv/h is a normal background radiation level. However this level depends on where you live of course. Check out Wikipedia (h**ps://en.wikipedia.org/wiki/Background_radiation#Background_dose_rate_examples) and of course the GMC radiation map (h**p://www.gmcmap.com/). |
 |
|
| Reply #61
Exeter

7 Posts |
 Posted - 06/06/2016 : 17:37:34 Posted - 06/06/2016 : 17:37:34


|
| Thank-you so very much ! |
 |
|
| |
 Topic Topic  |
|

