| T O P I C R E V I E W |
| FE678 |
Posted - 07/03/2021 : 02:19:26
Hi,
Can anyone offer me some advice?
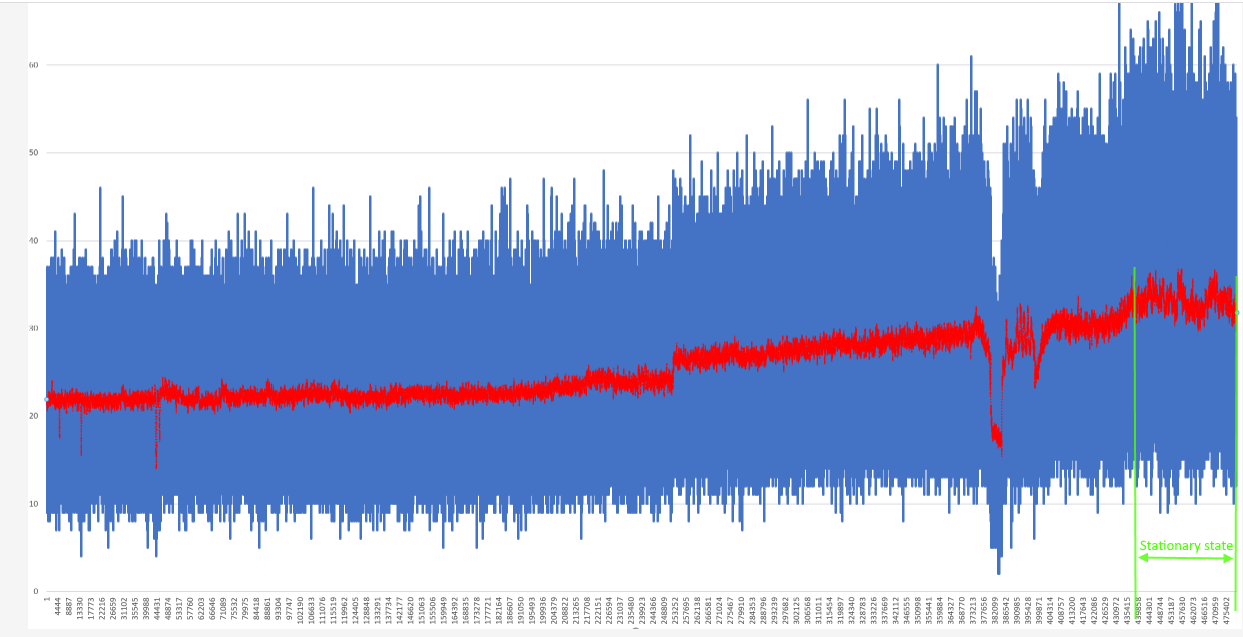
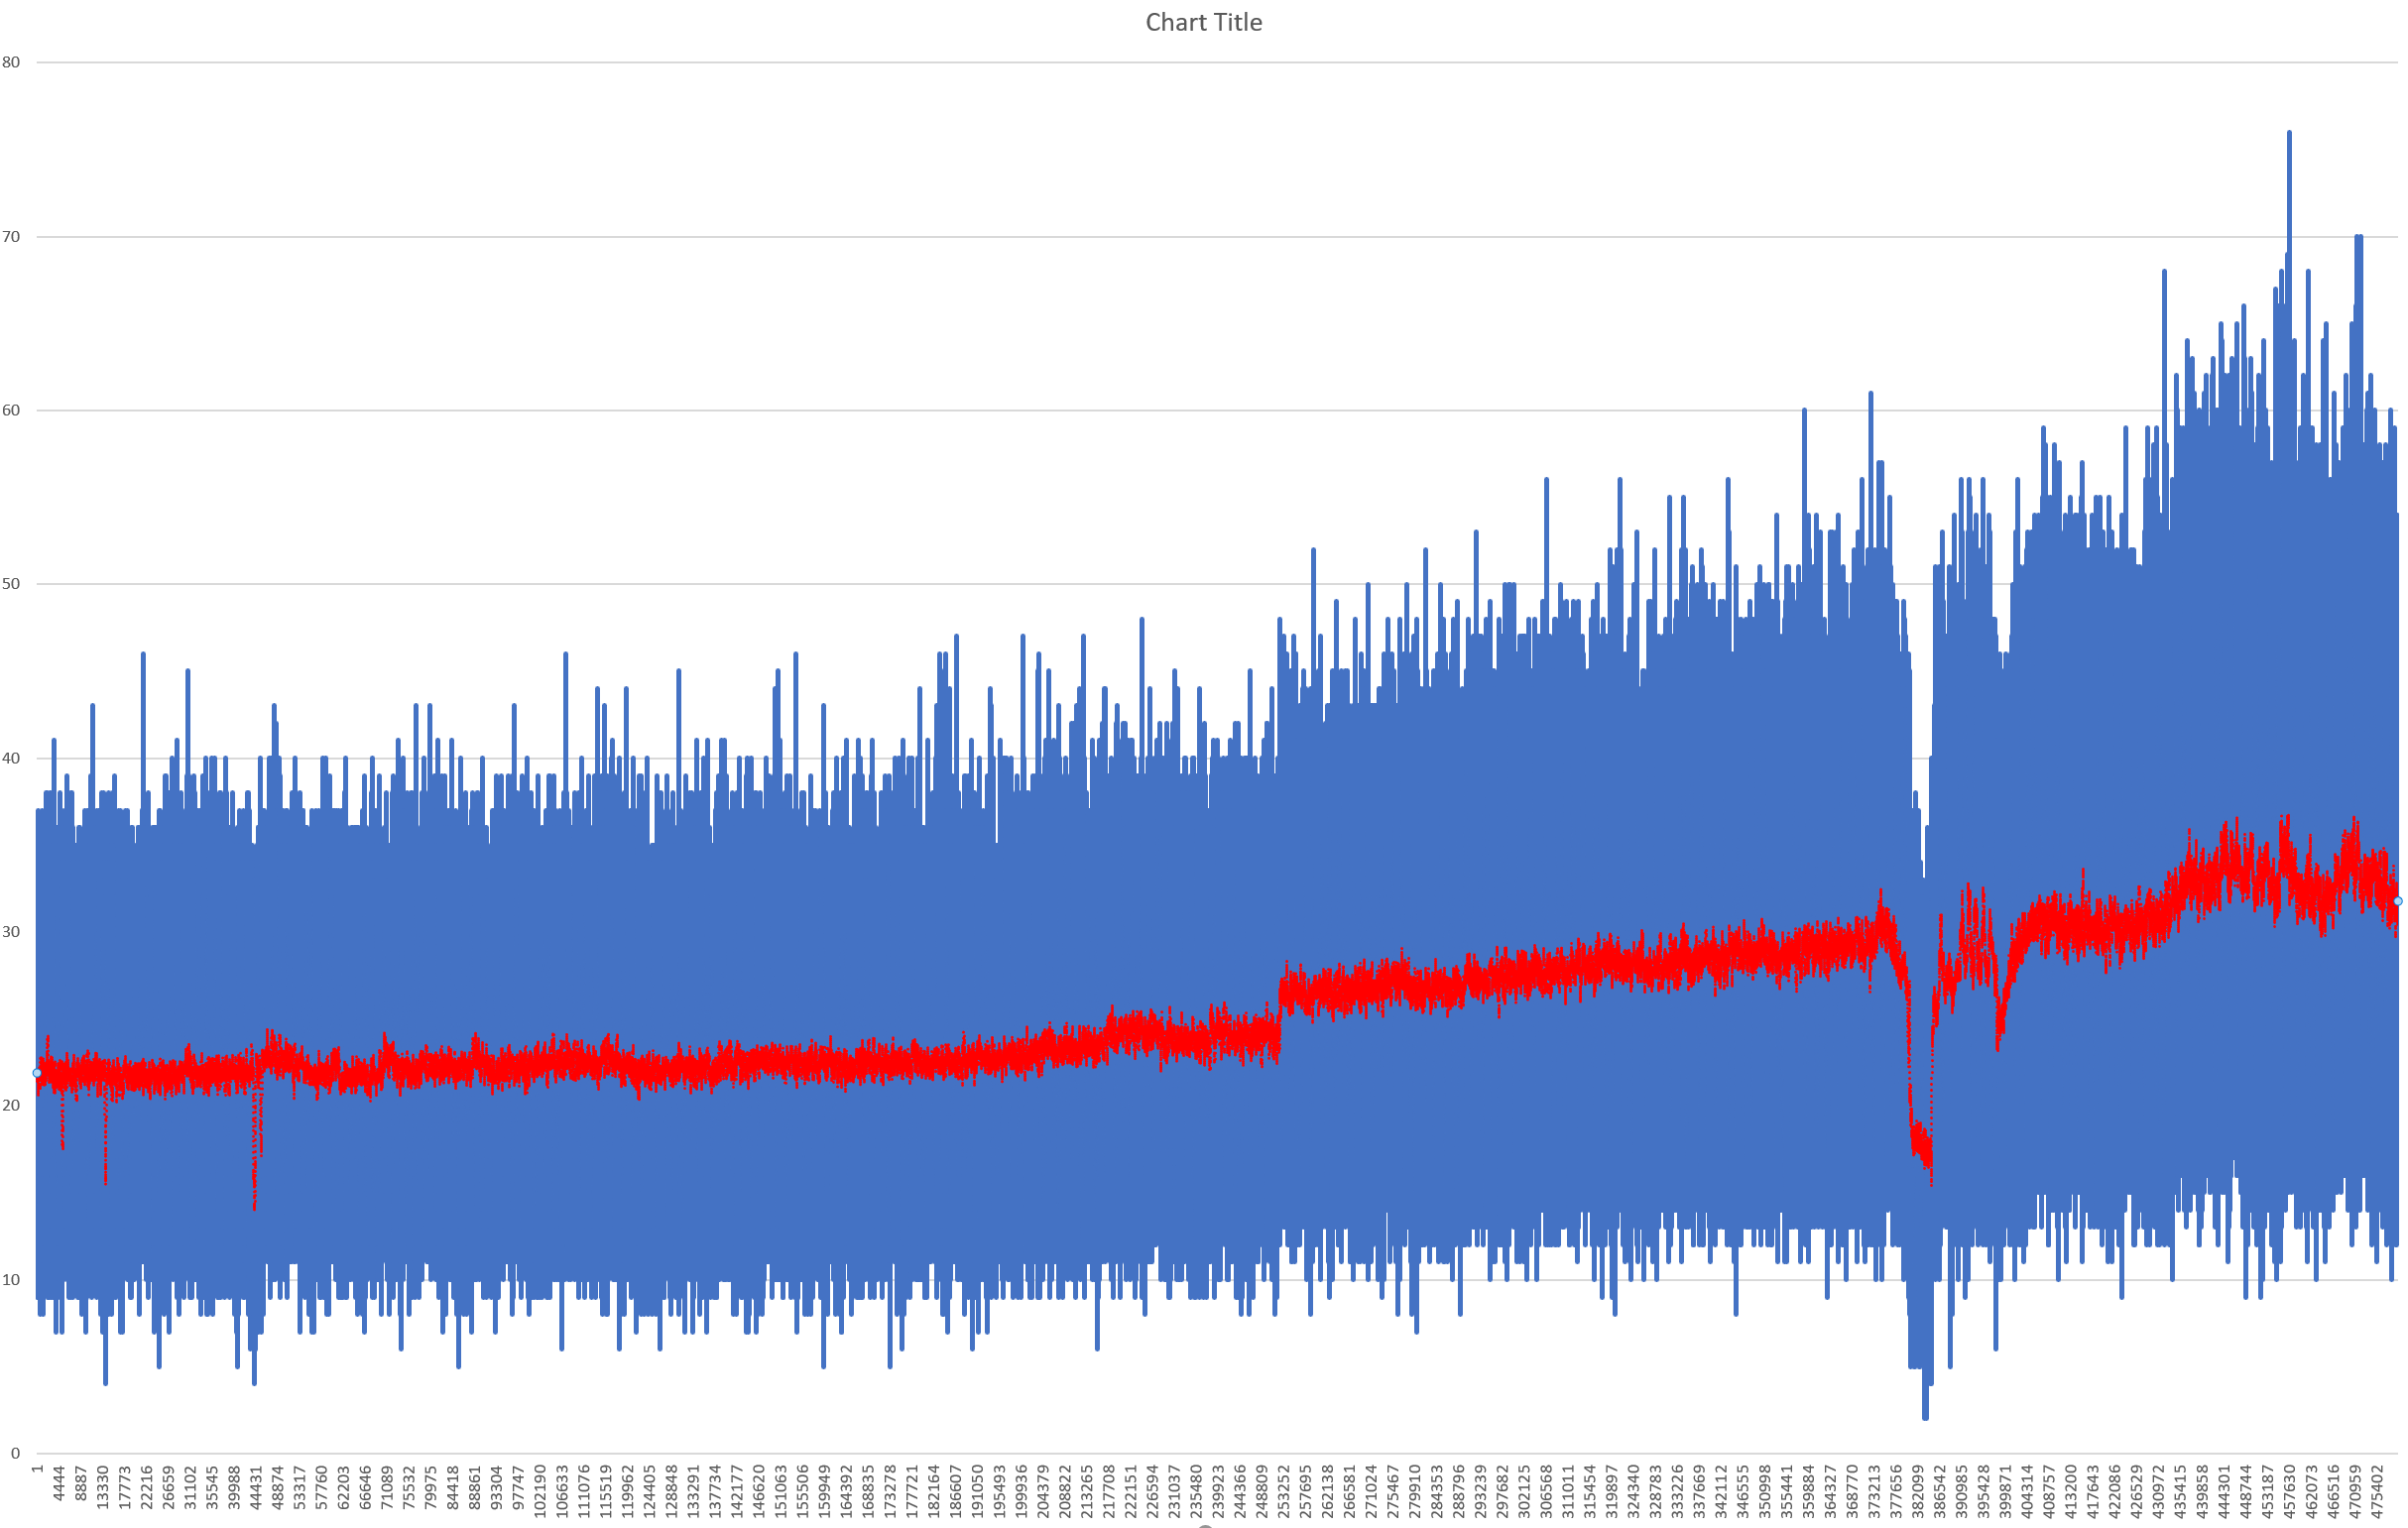
I have plotted the data from my GMC500 counter over around a one year period and notice that the average count has increased over time. The device has been moved to various positions in the house and occasionally taken outside, but on average the trend seems to be an increase in the count rate. Each data point is recorded at 1 minute intervals, and the red line is the 99 data point moving average. Is this a behaviour of the counter due to battery aging etc? Or is this because there is a build up of radiation in my house? |
| 7 L A T E S T R E P L I E S (Newest First) |
| Damien68 |
Posted - 07/03/2021 : 14:23:01
Hi FE678,
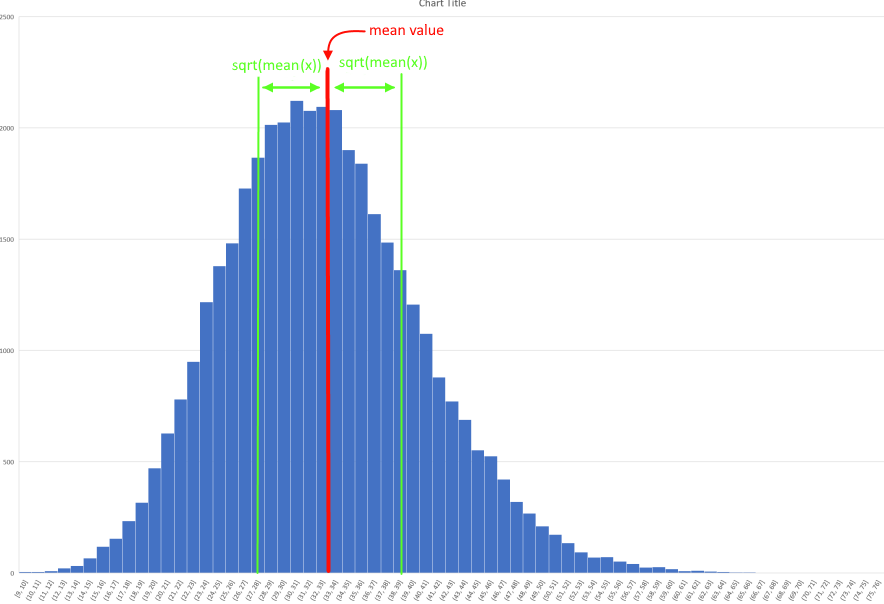
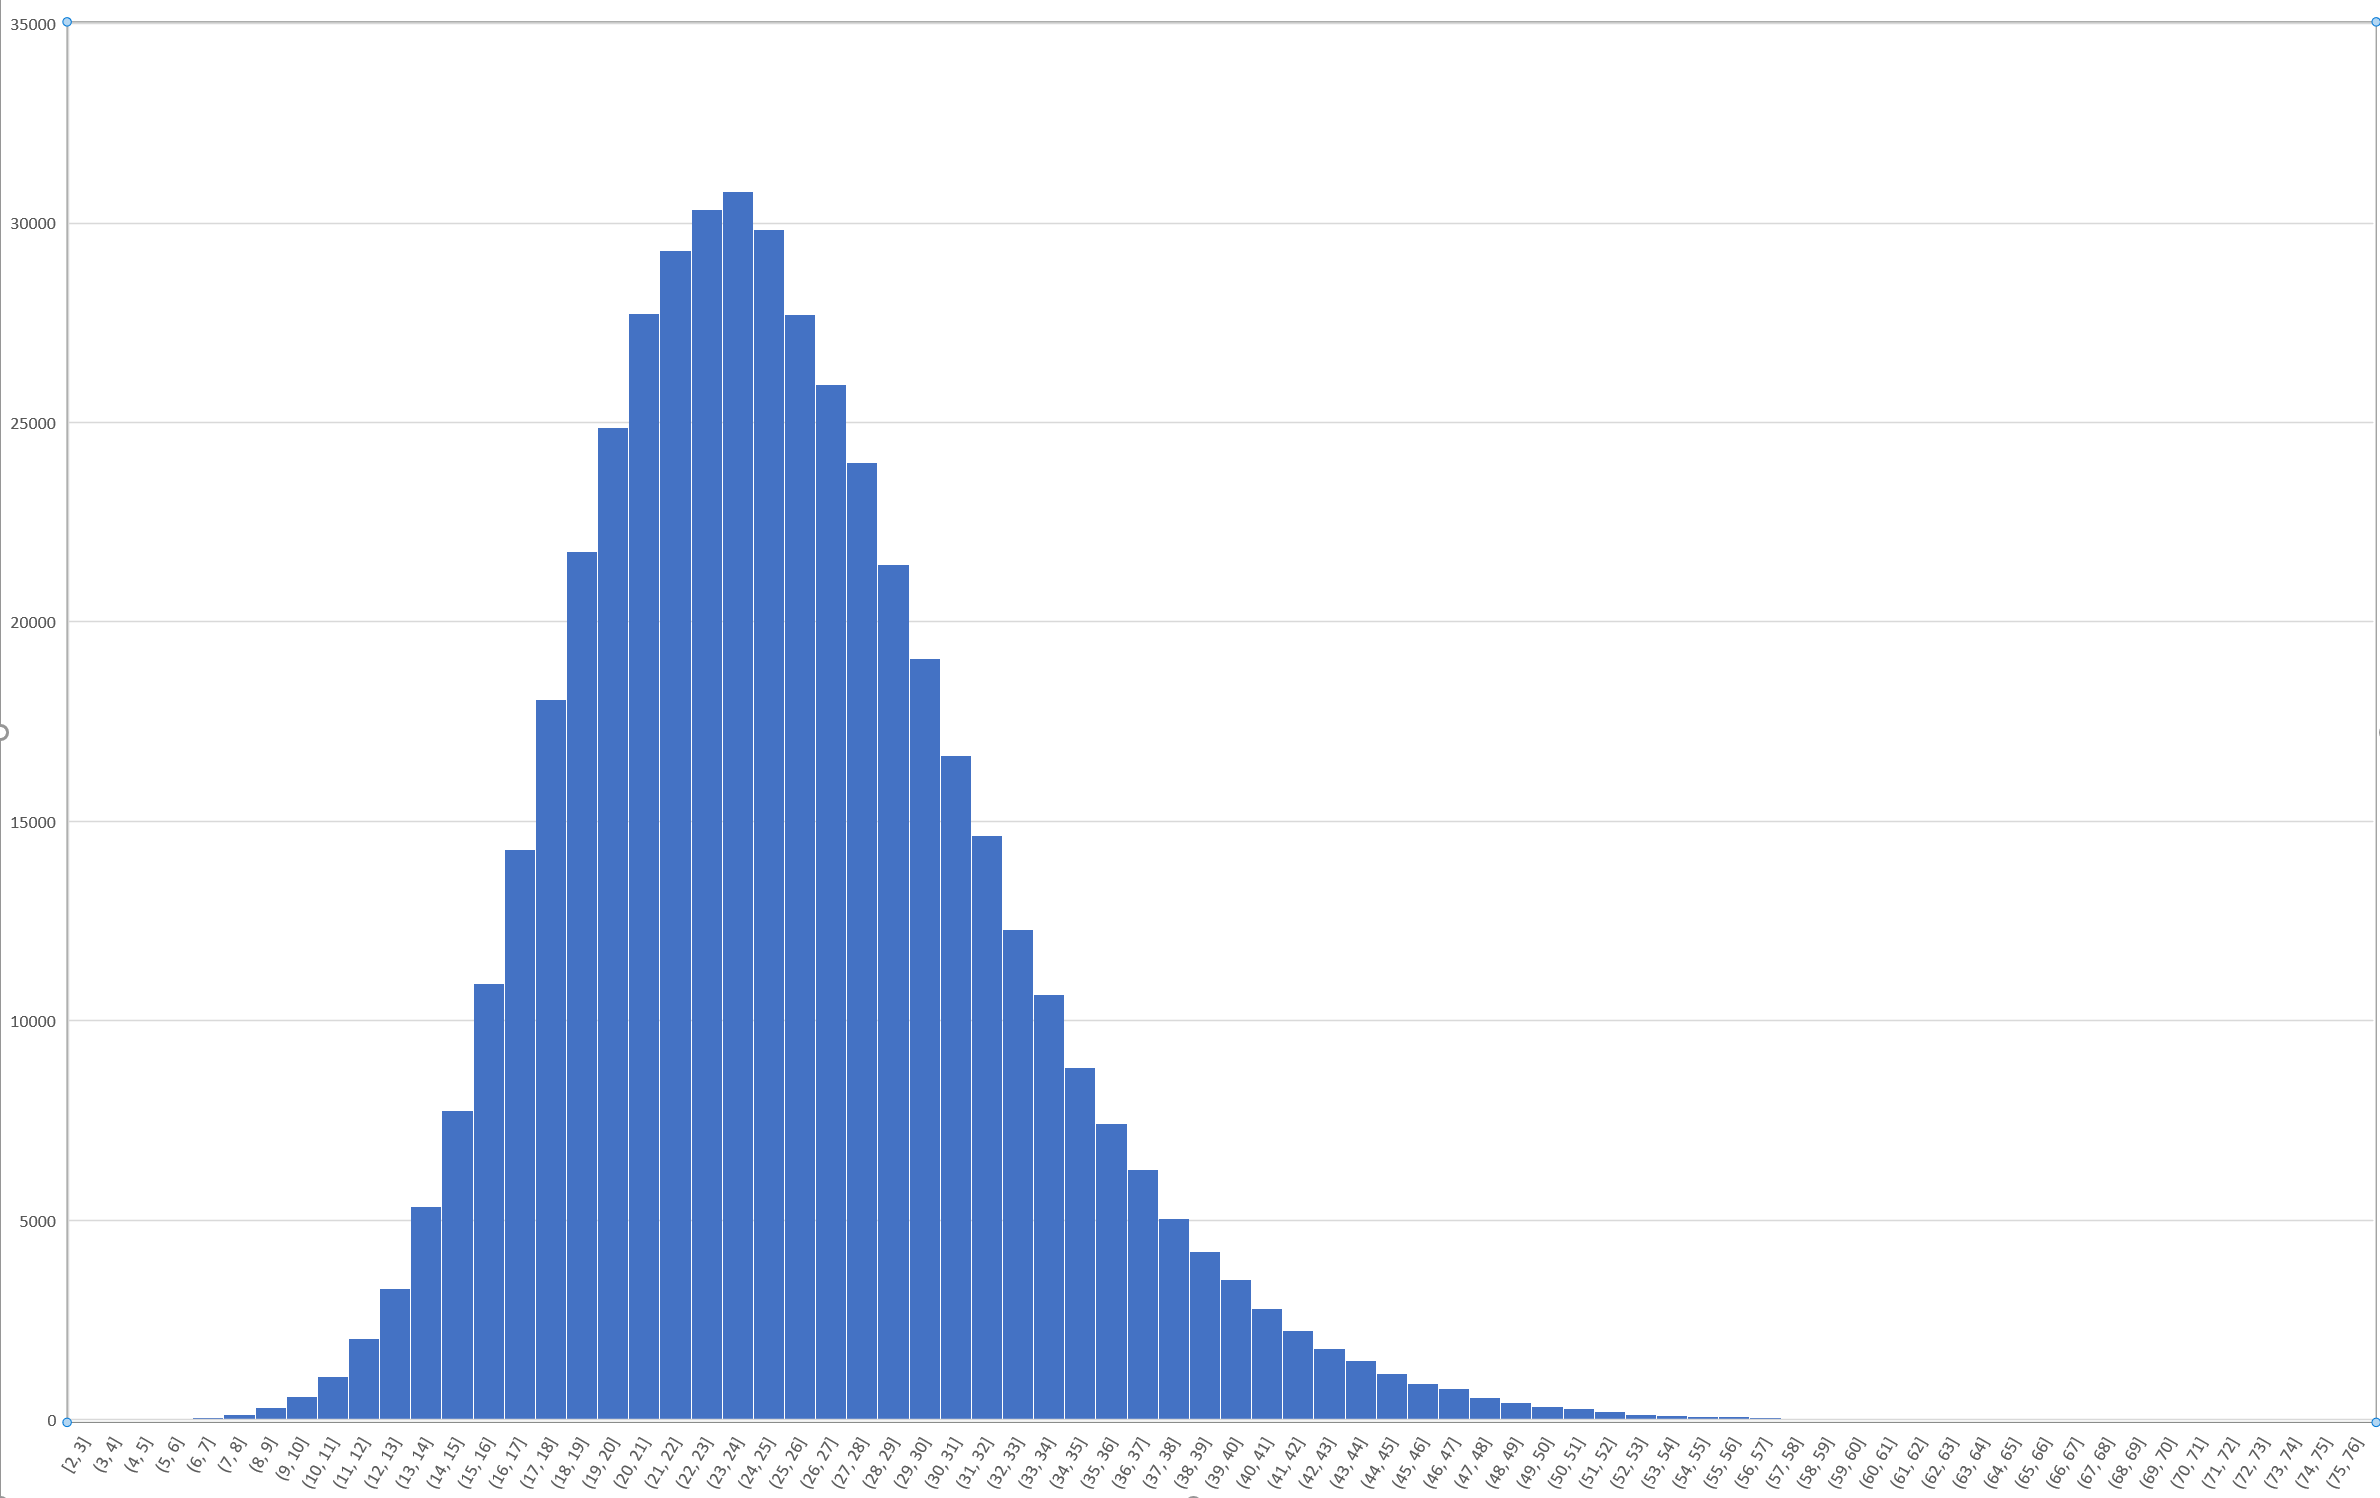
with a mean value of 32.5CPM and a total of 475402-440000 = 35402 Sample:
The Gaussian should peak at a value of 35402 / (5.7 / 0.399) = 2478 occurrences. but on your histogram it culminates at 2100 occurrences.
we also see that the distribution hystogram is not centered on mean value and be much larger than it should be if the distribution were Poissonnienne.
So we can simply conclude that your distribution is not Poissonian.
The reason is not obvious to understand.
The easiest would be to have a second counter to confirm or not the variations, but they can be natural (related to the environment), I would rather go for this hypothesis.
At home I have an average of 31 CPM inside my home and outside my home an average of around 22 CPM. if I approach the meter to a wall, it goes even higher.
 |
| FE678 |
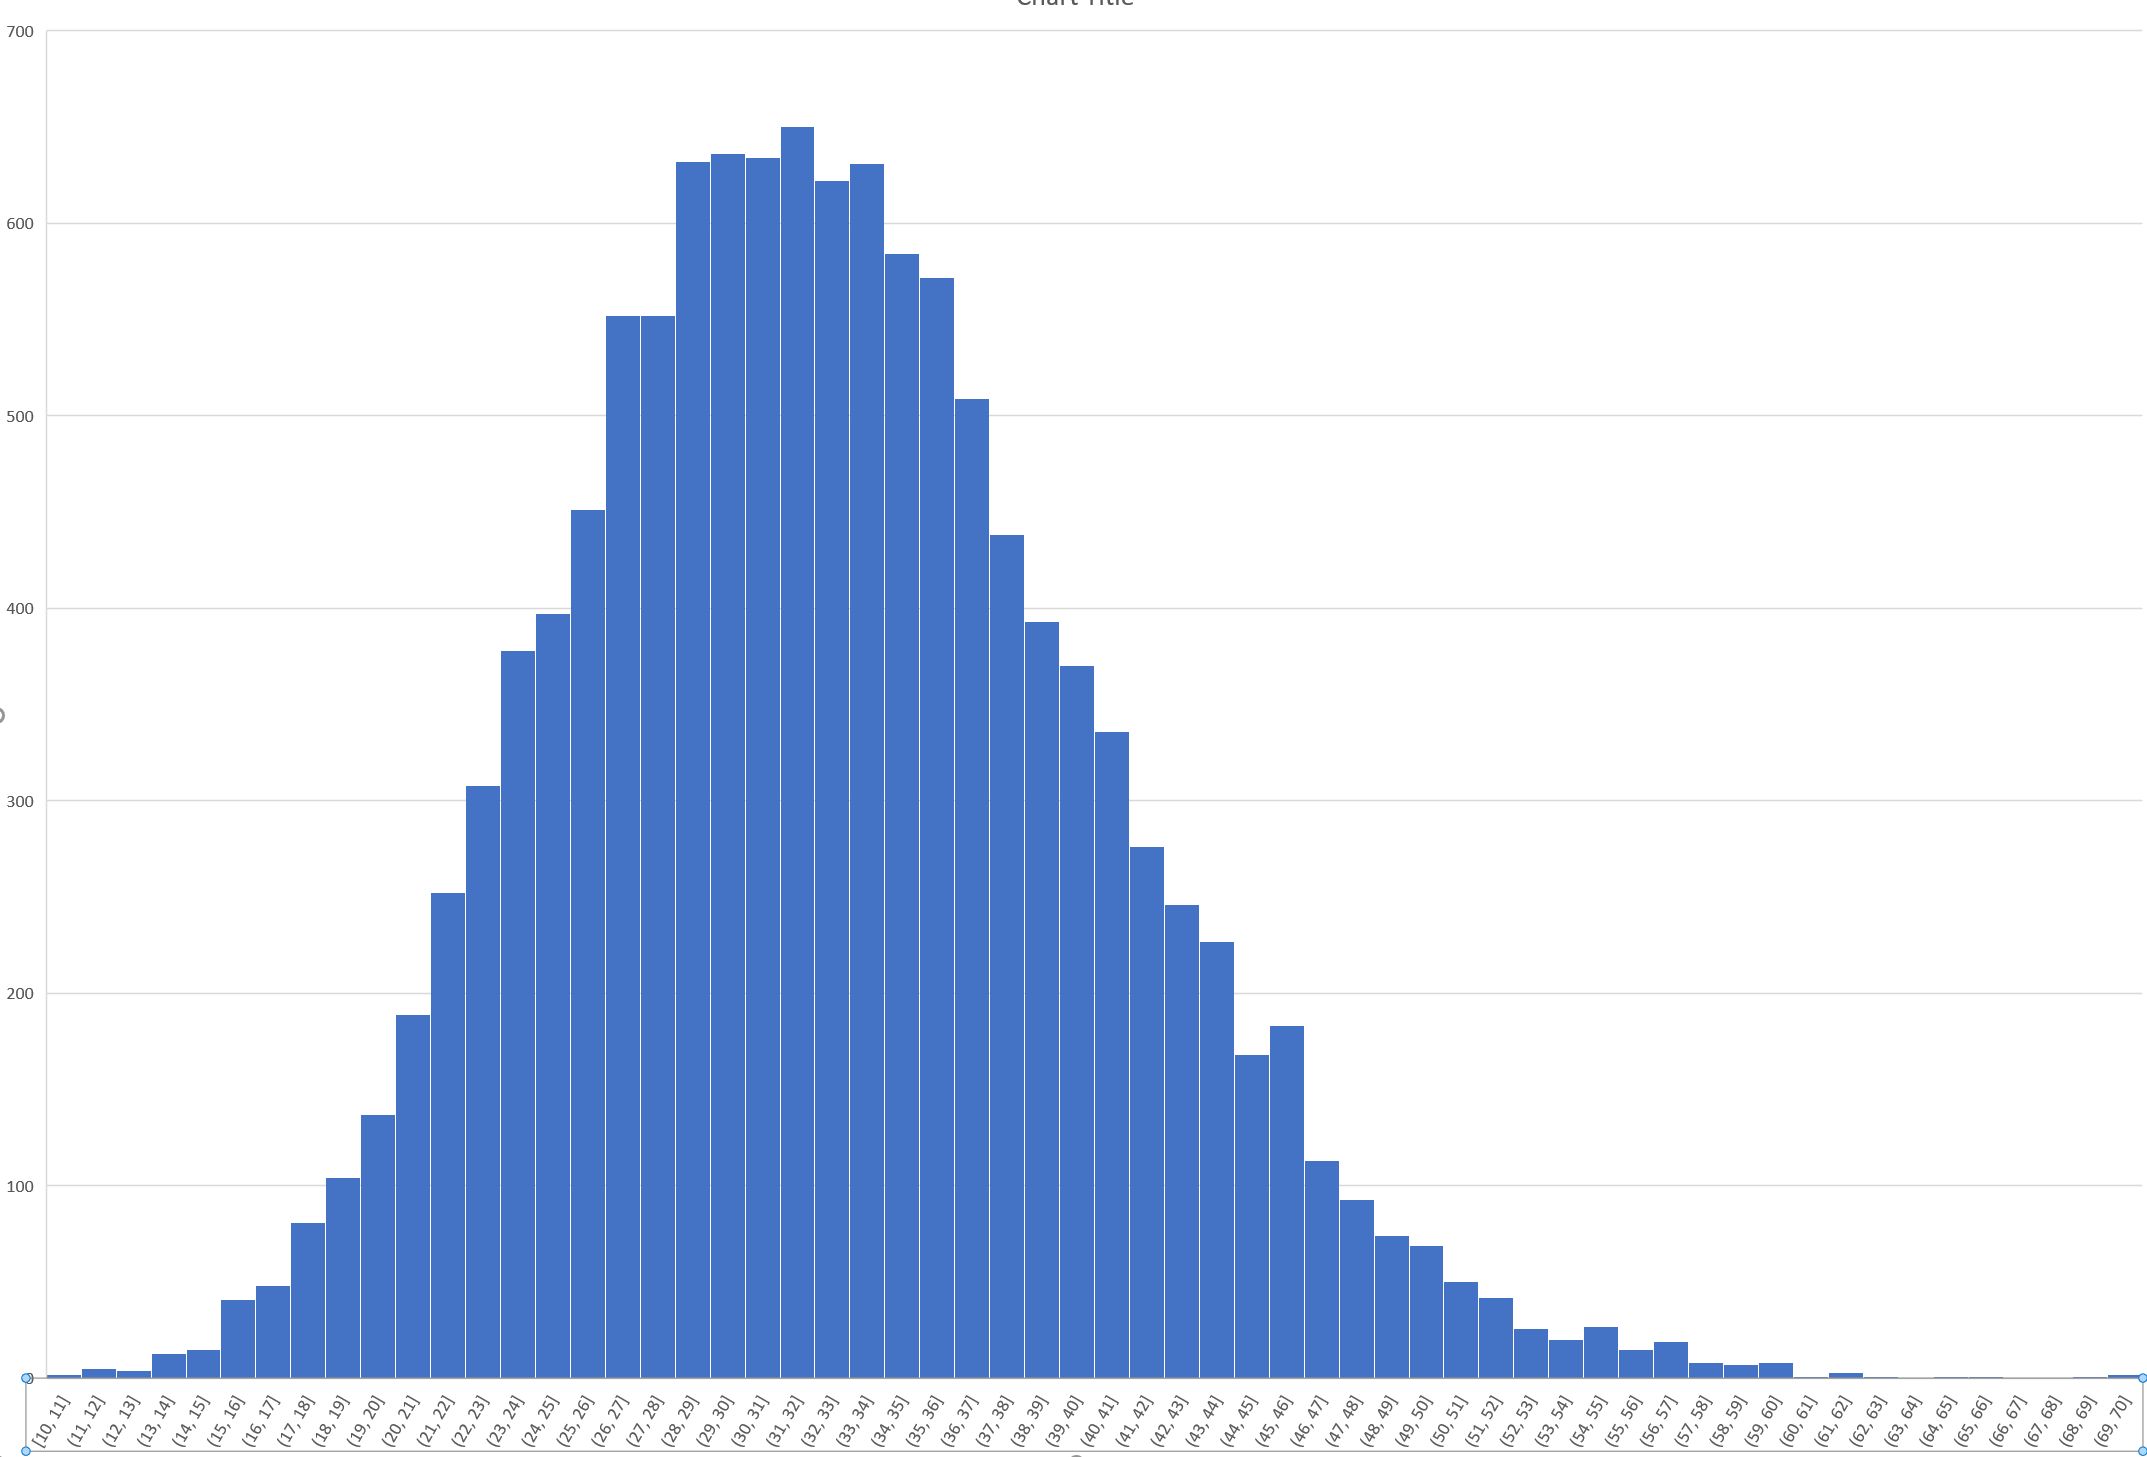
Posted - 07/03/2021 : 11:41:51
Here is data from the last week only
 |
| FE678 |
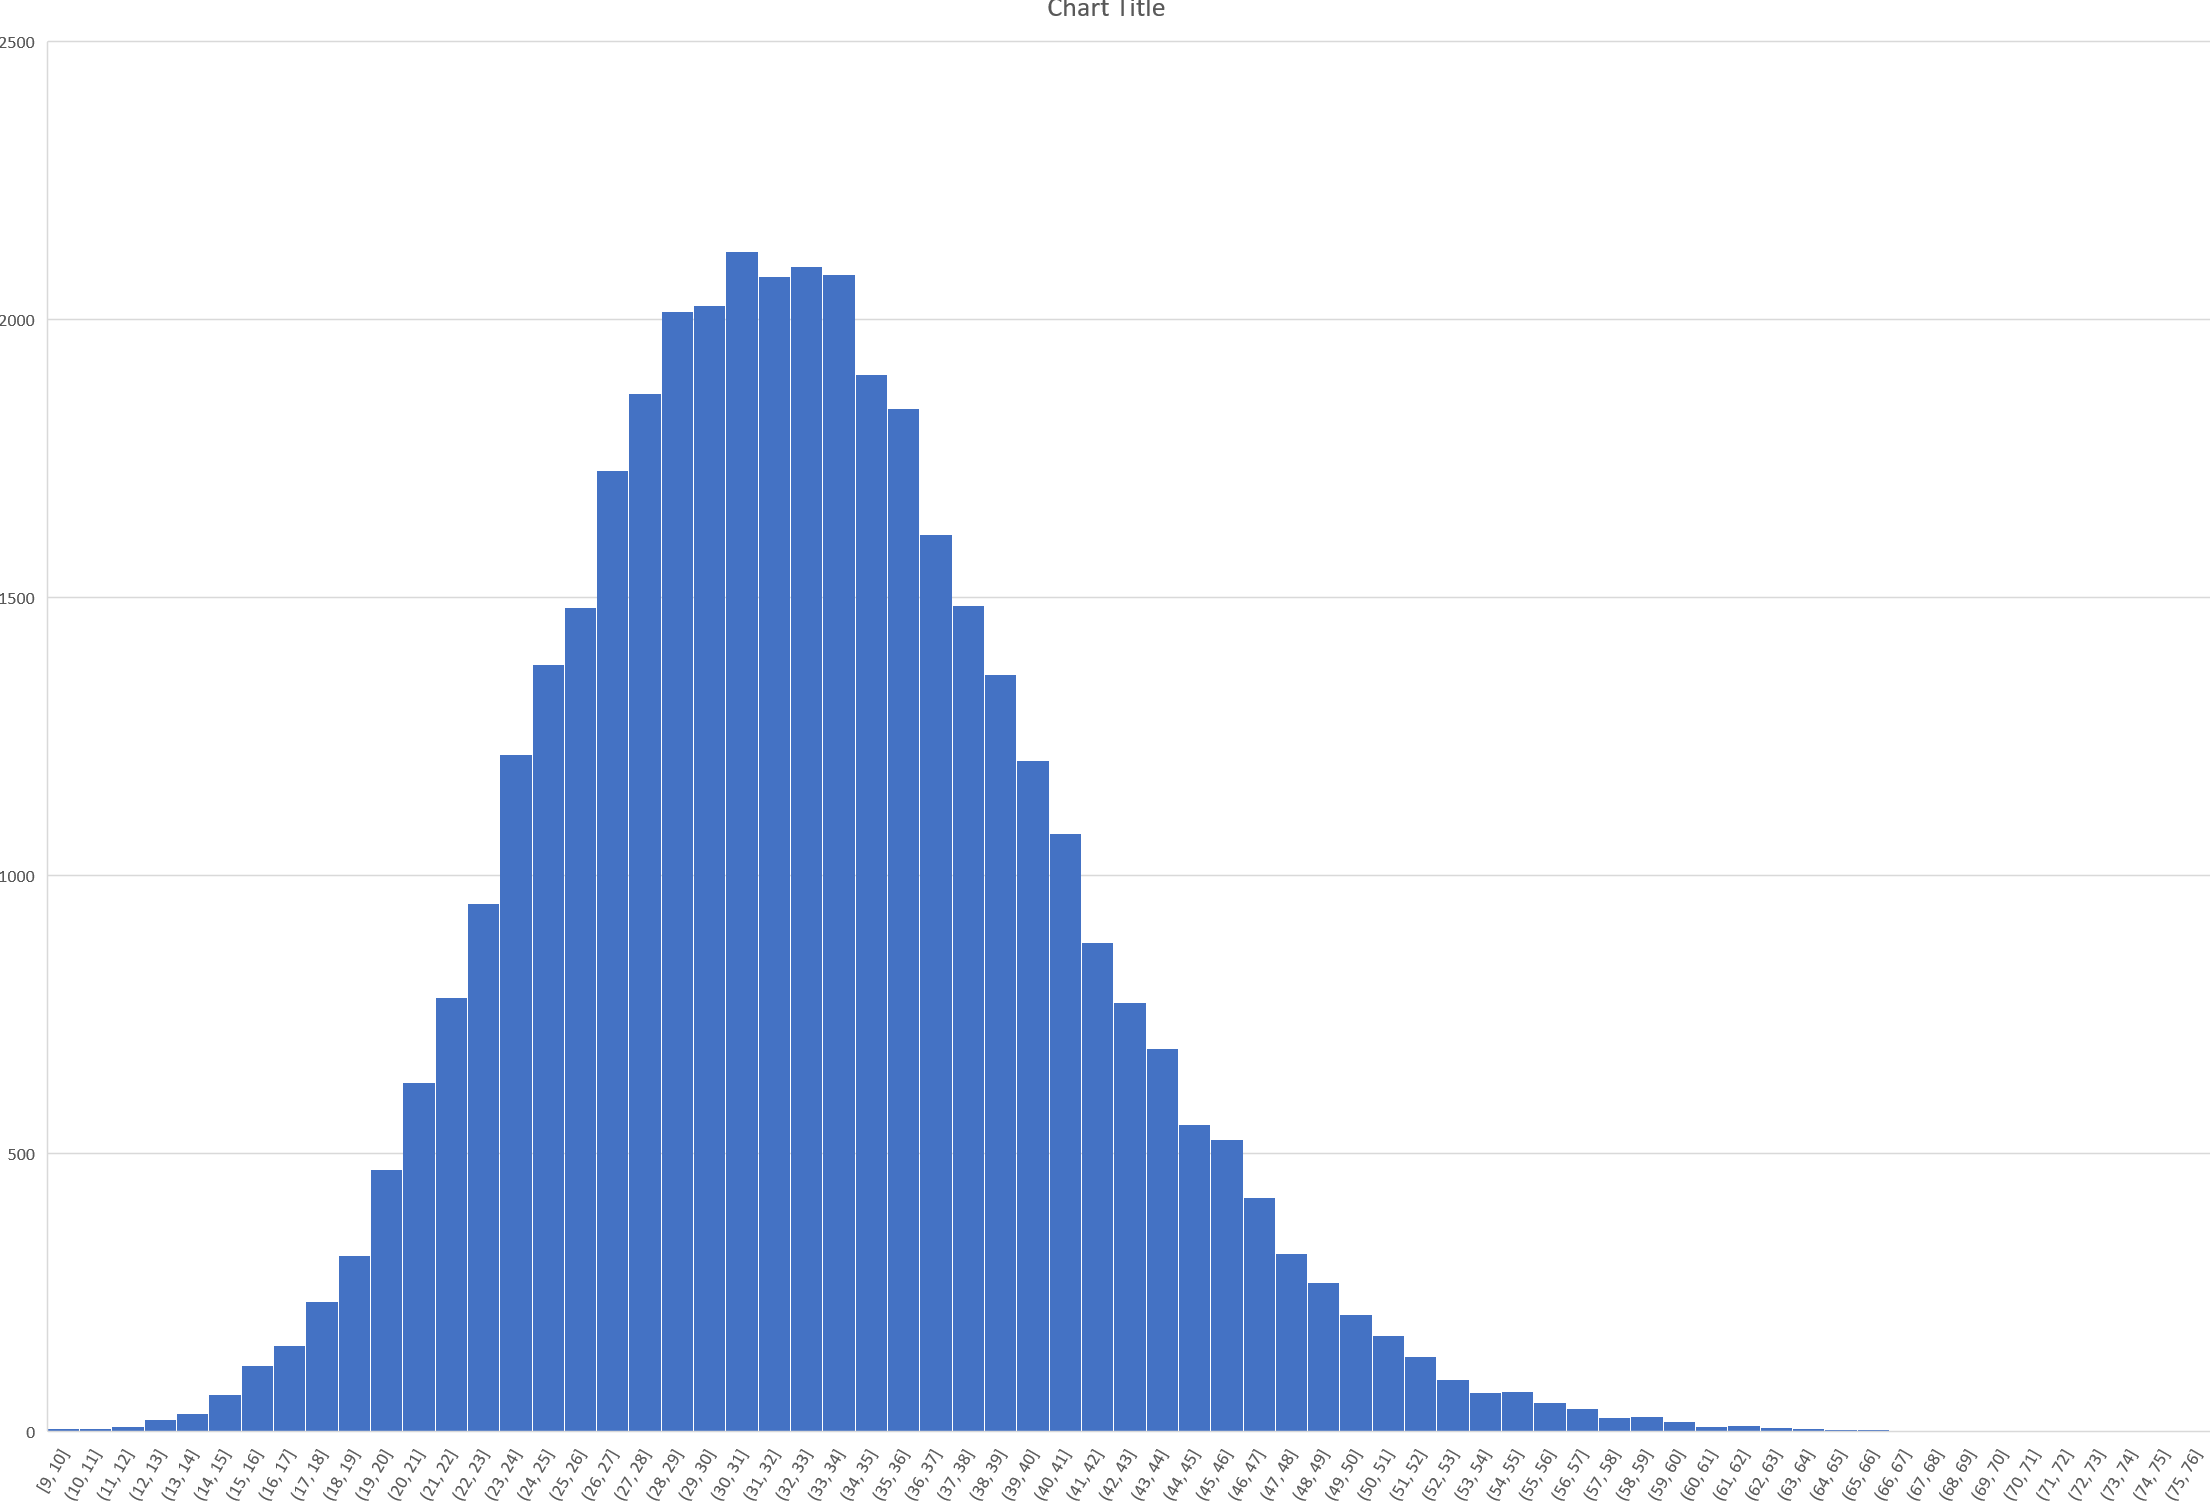
Posted - 07/03/2021 : 11:26:17
Thanks for deciding to help me. This is data after 440000. It does include the counter being left in a number of different locations for a day or two and represents about a month of data.
 |
| Damien68 |
Posted - 07/03/2021 : 05:39:38
At the end of your recording the red and blue curve are no longer centered together. it may be aliasing effects but I have the impression that the signal is no longer Poissonian nor Gaussian at all, which would mean that it's not your environment that is accumulating radioactivity.
So if you can plot histogram from sample 440000 to the end of your recording, this corespond to a pseudo stationary state, and would allow to know whether or not the signal is Gaussian and Poissonian.
|
| FE678 |
Posted - 07/03/2021 : 02:34:11
 |
| FE678 |
Posted - 07/03/2021 : 02:21:36
 |
| FE678 |
Posted - 07/03/2021 : 02:20:47
Having issues uploading the graph... says I have to be logged in, but think I am... |