| T O P I C R E V I E W |
| sprezzatura |
Posted - 02/21/2020 : 07:35:41
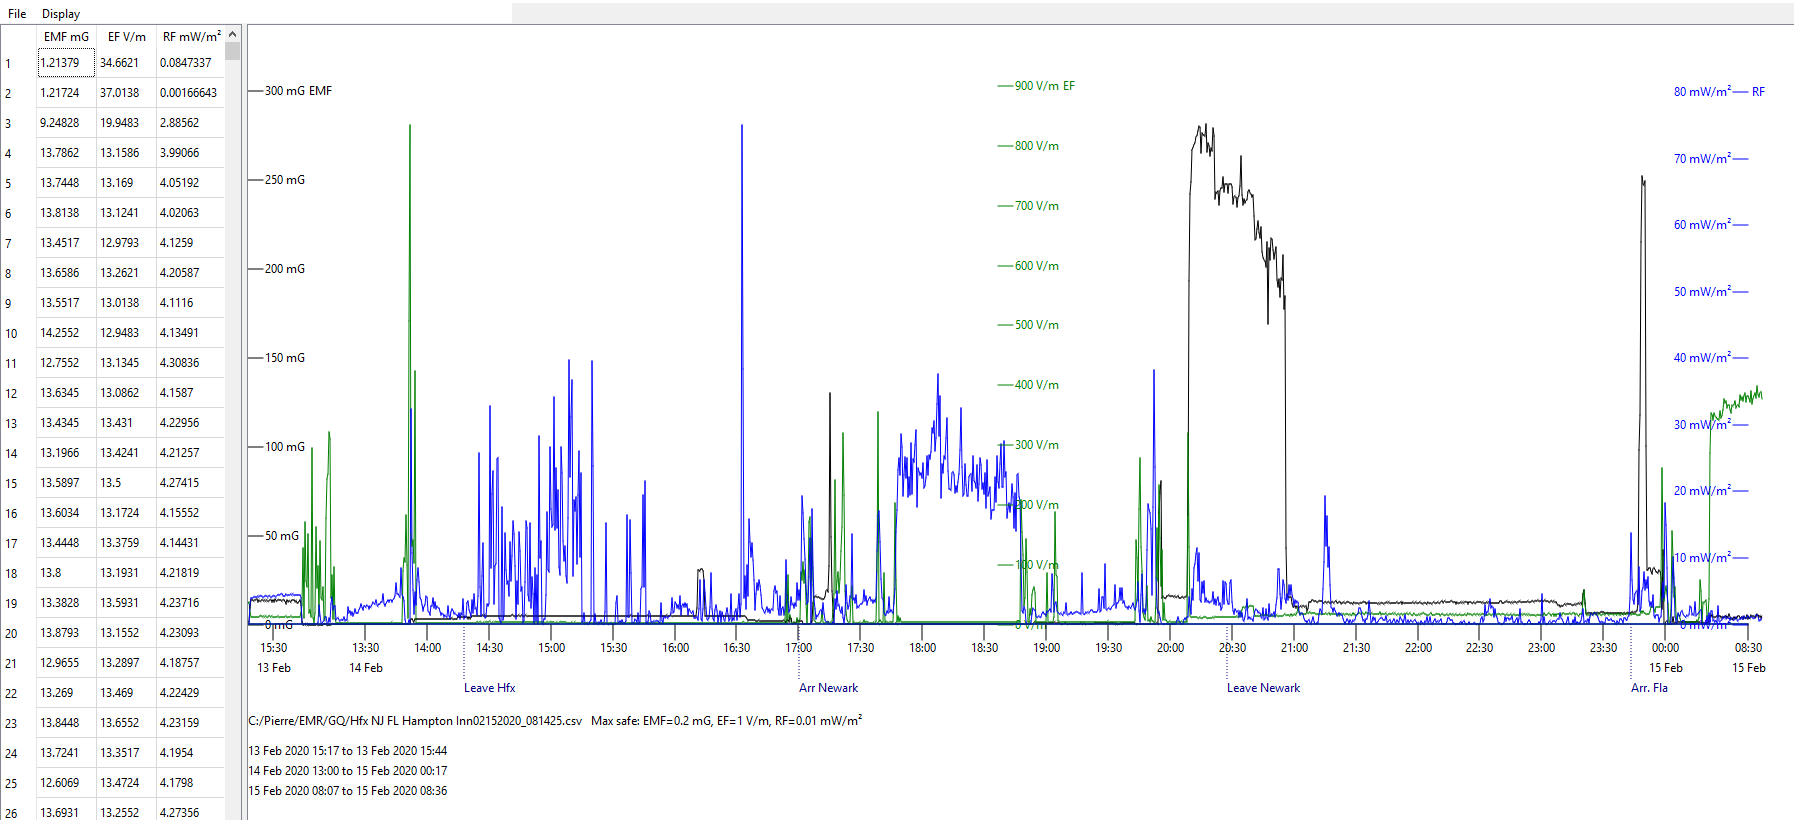
I've developed a Windows program to create nice annotated charts from GQ EMF-390 log files. You can download it free from "kyber.ca/f/GQ390_chart.zip".
To use, simply:
- Download & unzip
- Double-click on "chart.exe"
- Click on the menu "File, Open", browse to the CSV file that you downloaded from your EMF-390.
- You can annotate the chart by entering comments in col. 5 ("Label"). Save the chart to preserve your comments
There's lots of room for enhancements. Let me know what you think.
Image Insert:
160941 bytes |
| 6 L A T E S T R E P L I E S (Newest First) |
| BorisG |
Posted - 05/10/2020 : 17:16:40
Thanks for posting the graphing program. Just got a couple of the EMF-390's a few weeks ago and took one out on walks yesterday and today. Was just about to write a Q&D VB program to reformat the data to use with DPlot when decided to look on forum to see if someone had already posted any software. Allowed me to look at data quickly to get an idea of what cell phones we were carrying had been doing on a hike in woods.
Weird data format as seems to have a timestamp string periodically and am assuming that equally spaced intervals for all readings in between but just got these new toys so will be playing with them a lot in near future.
Will likely still be writing my own code to analyze data as really like using DPlot for making my graphs, but this program allowed me to quickly see what data looked like and will make my wife happy since I'll be heading out to do some work in garden rather than sitting downstairs coding.
|
| GMA |
Posted - 05/08/2020 : 12:27:45
quote:
Originally posted by sprezzatura
The problem has been fixed (26 Feb 2020). Simply download again and re-install.
Thank you very much! The program is super! It would be nice to add lines of average data values to the chart. Very convenient and useful program. Thanks!) |
| igel |
Posted - 04/08/2020 : 09:10:57
quote:
Originally posted by sprezzatura
The problem has been fixed (26 Feb 2020). Simply download again and re-install.
Can You add EM XYZ graph? |
| sprezzatura |
Posted - 03/02/2020 : 13:39:59
The problem has been fixed (26 Feb 2020). Simply download again and re-install. |
| EmfDev |
Posted - 02/24/2020 : 14:41:02
Hi sprezzatura, I've downloaded your software on my PC but when I lock the exe file, it says "This application failed to start because no Qt platform plugin could be initialized....." |
| EmfDev |
Posted - 02/21/2020 : 09:43:37
Wow your program looks neat. Thanks for sharing!. |