| Author |
 Topic Topic  |
|
|
colonel

4 Posts |
 Posted - 11/05/2018 : 07:06:01 Posted - 11/05/2018 : 07:06:01


|
Hi,
Newbie here!
I have just bought the GMC-500+ and am having fun with it generally
I live in the UK
I carried it to work to record the changes in the background radiation on the way and noticed that my house is average 18-27 CPM, the area where I live (in the street) around 12-17, the tube/underground 9-15 and where I work (office block in East London) around 10-15
My question is how sensitive the GM-500+ actually is, how much readings at this low level fluctuate naturally and what is the margin of error with this type of device ?
e.g. is there any practical difference between 10 and 15 CPM or between 10 and 20 CPM or between 10 and 30 CPM ?
many thanks in advance
|
|
| Reply #1
Stargazer 40

USA
431 Posts |
Posted - 11/05/2018 : 07:30:34
|
I see daily fluctuation of 10-15CPM. You can record data and view in GQ's viewer. Or you can get ullix's GeigerLog software and do much more analysis of daily variations in background. This YouTube video shows how to use GQ's viewer.
https://www.youtube.com/watch?v=X4WYn-O1ERg |
Stargazer 40 |
 |
|
| Reply #2
colonel
4 Posts |
Posted - 11/05/2018 : 11:59:02
|
thanks will take a look at that software
quote:
Originally posted by Stargazer 40
I see daily fluctuation of 10-15CPM. You can record data and view in GQ's viewer. Or you can get ullix's GeigerLog software and do much more analysis of daily variations in background. This YouTube video shows how to use GQ's viewer.
https://www.youtube.com/watch?v=X4WYn-O1ERg
|
|
|
| Reply #3
EmfDev

2415 Posts |
Posted - 11/05/2018 : 17:16:04
|
Hi colonel, it's hard to see the difference by just using the CPM if the readings are just background.
I suggest that you use timed count instead of just the CPM. You can set the timed count for 1 hr/60 mins or maybe 1 day
then you can get the total count from that. Do it to your house, then to your work. This way, it's easier to
notice if there's difference in the total counts. |
Edited by - EmfDev on 11/05/2018 17:16:23 |
|
|
| Reply #4
GBG12
Canada
103 Posts |
Posted - 11/05/2018 : 21:00:27
|
| If the timed counts show the same variation between locations that you reported, it is possible that your house may have Radon accumulation seeping in from the surrounding earth. Many homes have this issue. |
|
|
| Reply #5
colonel
4 Posts |
Posted - 11/06/2018 : 00:23:31
|
very interesting, thanks. Timed count sounds a good idea - I should have thought of that!
|
|
|
| Reply #6
ullix
Germany
1244 Posts |
Posted - 11/06/2018 : 02:49:16
|
@colonel: your questions are quite appropriate though impossible to answer with the information provided. You will be able to answer them yourself when you better understand the nature of the "fluctuations" of a radioactive counts signal.
Although such Geiger counts do come strictly at random, there is a pattern in this fluctuation, which can be described with a "Poisson Distribution".
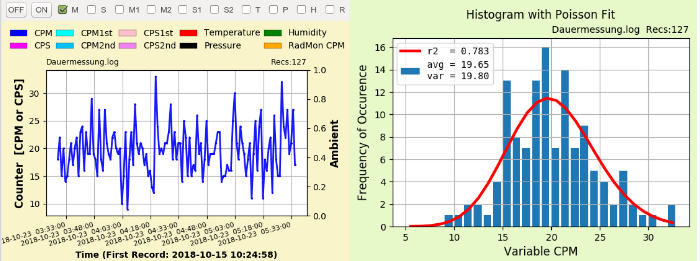
In the picture (left side) you see a recording of the Time course of the counts using a GMC-500+ counter. It is a good background recording, albeit a short one. On the right side is a plot of the frequency of CPM occurences with a fitted Poisson Distribution derived from exactly this time course.
Image Insert:
80282 bytes
While the CPM do come at random, fluctuating from CPM=9 up to 33, their distribution is not random at all!
All the 3 ranges you provided from 10 up to 30 CPM are covered by the above time course. And here they are not indicative of 3 different situations, but do come from a single background signal of CPM=19.65 average.
Thus you can't draw any conclusions about your 3 conditions, unless you provide time courses of sufficient length to get the statistics to the point where you can draw conclusions.
More on this topic in my "Potty Training ..." article downloadable here: https://sourceforge.net/projects/geigerlog/files/ . For the comparison of similar count rate signals (as in your case) you will find more to that challenge in the "Going Banana ..." article on the same site.
|
|
|
| Reply #7
colonel
4 Posts |
Posted - 11/06/2018 : 04:21:51
|
thanks - will read
|
|
|
| Reply #8
donghelan

Japan
65 Posts |
Posted - 11/06/2018 : 07:27:59
|
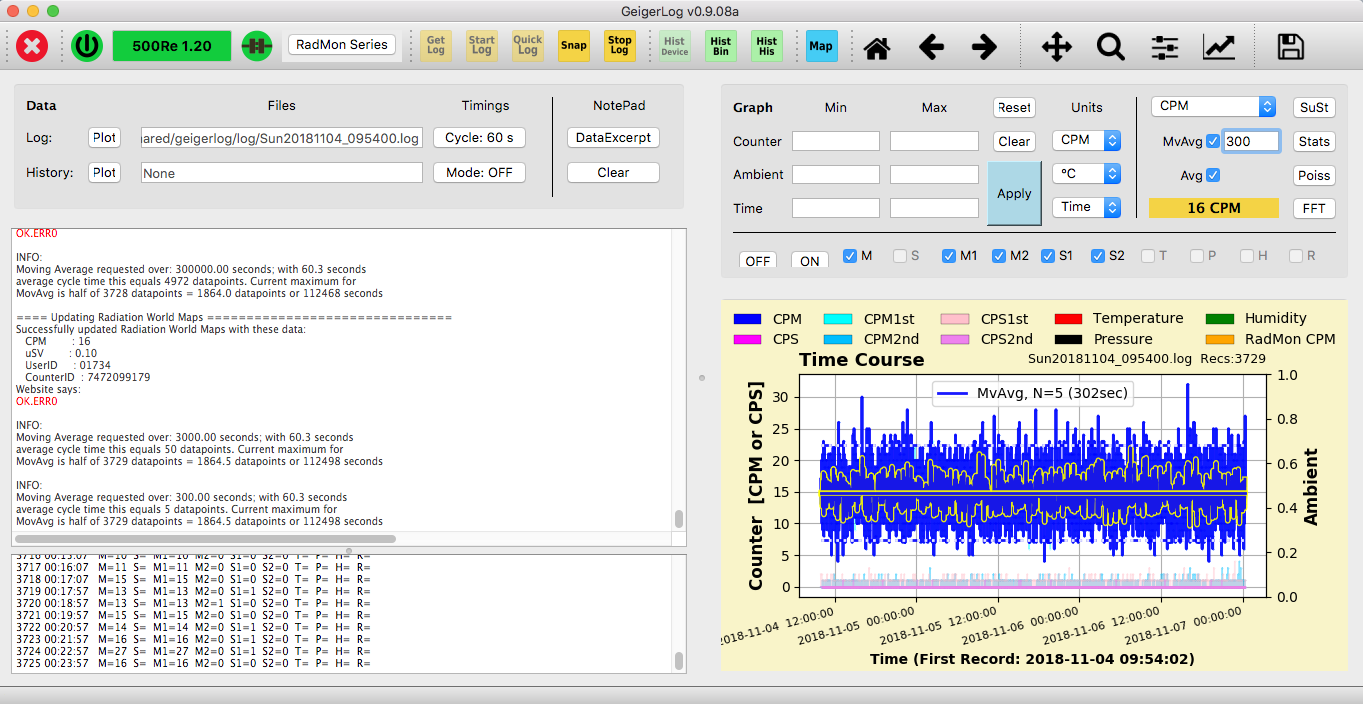
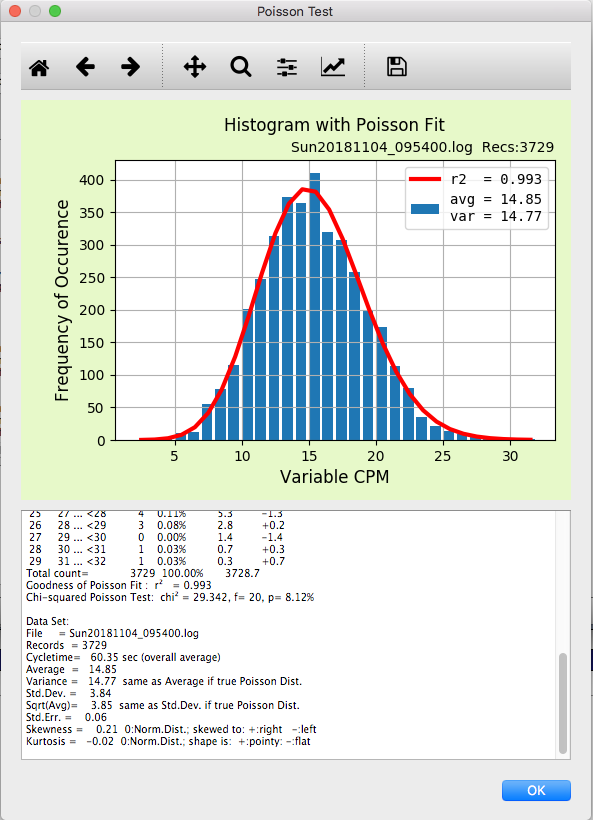
Really recommend Ullix's GeigerLog which I have enhanced recently with sending CPMs (GM Tube CMP1st values only) every minute to www.gmcmap.com/index.asp to be able to analyze and compare long term locally and globally with others.
@Ullix I am still beautifying the code before sending to you for review (if you like).
N.B.: Still have to improve the moment the messages are sent. Current implementation is not very accurate +/- 15 secs.
That is probably a Python interpreter delay issue and the Operating system is not realtime.
Image Insert:
323246 bytes
Image Insert:
110376 bytes |
To bug or not debug, that is the Q |
Edited by - donghelan on 11/06/2018 15:32:14 |
|
|
| |
Topic |
|