| Author |
 Topic Topic  |
|
|
njc
 
USA
16 Posts |
 Posted - 03/11/2013 : 12:01:31 Posted - 03/11/2013 : 12:01:31


|
Would it be possible to get a schematic of the GMC-300? I'd like to possibly modify mine for an LED, serial communications, or perhaps a different tube.
Thanks,
Nick |
|
| Reply #1
ZLM
    
1271 Posts |
 Posted - 03/12/2013 : 21:09:34 Posted - 03/12/2013 : 21:09:34


|
| If you want to a speicific mod, then I may give you some ideas. But I do not have the schematic since this is not an open source project. |
 |
|
| Reply #2
njc
 
USA
16 Posts |
 Posted - 03/18/2013 : 08:42:28 Posted - 03/18/2013 : 08:42:28


|
Alright then maybe you could tell me the following:
What do each of the pots do? I'm pretty sure one is for tube voltage.
How might I go about putting an LED to flash with each count? (not in parallel with the speaker -- I want to be able to disable the speaker and just have LED). Is there an output from the micro I could use?
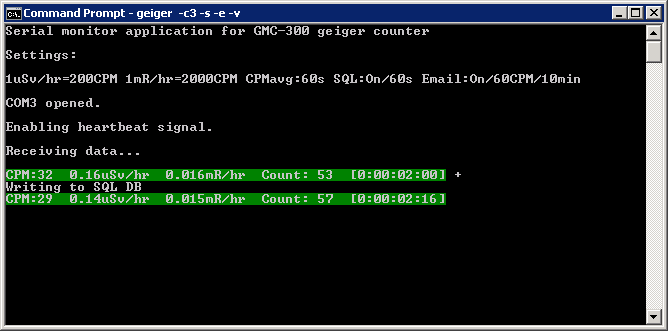
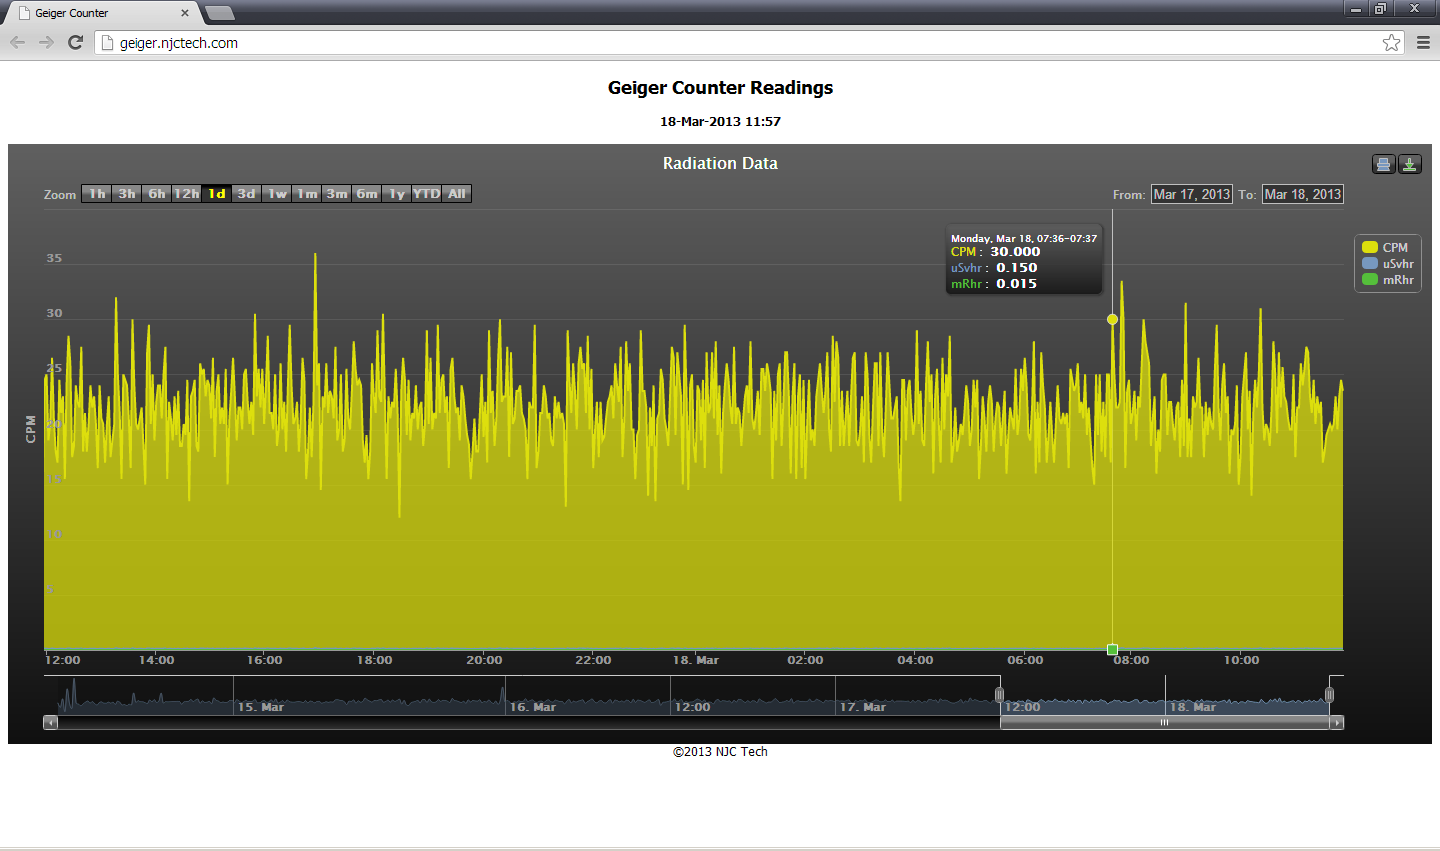
That's really it for now. I wrote an app to read the data from the unit and store it to a SQL satabase from which I can display data. The app can also email/text if a threshold is breached and has some other txt file logging options. It's a work in progress :)
See here: geiger.njctech.com/

Image Insert:

10.95 KB

Image Insert:

114.81 KB |
 |
|
| Reply #3
njc
 
USA
16 Posts |
 Posted - 03/18/2013 : 08:43:16 Posted - 03/18/2013 : 08:43:16


|
| Why can't I link images?! |
 |
|
| Reply #4
ZLM
    
1271 Posts |
 Posted - 03/18/2013 : 20:44:02 Posted - 03/18/2013 : 20:44:02


|
you have to upload the image to this server.
The easiest way is to replace the speaker with a LED(serial a 1K ohm resistor). |
 |
|
| Reply #5
njc
 
USA
16 Posts |
 Posted - 03/19/2013 : 07:16:57 Posted - 03/19/2013 : 07:16:57


|
| What about a way to have the LED still work when I disable the speaker from the UI? |
 |
|
| Reply #6
ZLM
    
1271 Posts |
 Posted - 03/21/2013 : 19:46:03 Posted - 03/21/2013 : 19:46:03


|
No. That is the only way.
If you want to keep the speaker, then you need to add more components.
eg. add a LM393 isolator. |
 |
|
| Reply #7
chillomatic
 
Germany
17 Posts |
 Posted - 03/22/2013 : 13:54:52 Posted - 03/22/2013 : 13:54:52


|
| Wow the graph looks nice! Is there a chance to get this for myself? |
 |
|
| Reply #8
njc
 
USA
16 Posts |
 Posted - 03/23/2013 : 19:18:06 Posted - 03/23/2013 : 19:18:06


|
chillomatic--
The charts are highcharts (www.highcharts.com) and use javascript/jQuery. You'll need a webserver to run them. The app I wrote reads the count-per-second data from the GMC-300, averages the data, and writes to a SQL database.
I will provide the app and the source (python) to anyone who is interested.
|
 |
|
| Reply #9
chillomatic
 
Germany
17 Posts |
 Posted - 03/24/2013 : 13:38:56 Posted - 03/24/2013 : 13:38:56


|
| I have a webserver on my NAS so i should be able to run it. I would be very interested in trying it out. |
 |
|
| Reply #10
ZLM
    
1271 Posts |
 Posted - 03/24/2013 : 15:20:23 Posted - 03/24/2013 : 15:20:23


|
| njc, Would you please post your code here? so that other users are able to benifit from it. |
 |
|
| Reply #11
njc
 
USA
16 Posts |
 Posted - 03/25/2013 : 14:49:32 Posted - 03/25/2013 : 14:49:32


|
geiger.njctech.com/geiger.zip
Source is included as well as win32 binaries.
Be sure to see the README.txt file for usage info.
Email or post here with any bugs, questions or comments.
ZLM: Perhaps move this to a more appropriate thread (the title of this one is about schematics) |
 |
|
| Reply #12
ZLM
    
1271 Posts |
 Posted - 03/27/2013 : 21:29:25 Posted - 03/27/2013 : 21:29:25


|
| Thank you. I have placed your code in download area. |
 |
|
| Reply #13
njc
 
USA
16 Posts |
 Posted - 04/10/2013 : 10:32:37 Posted - 04/10/2013 : 10:32:37


|
Thanks, ZLM.
I have added more customization by an .ini file as well as commandline switches. Instructions are included in the download.
You can now:
-log to .csv file
-log to SQL database
-customize email alerts
There is also a program log which logs events of the application as it is running. I added a lot of comments to the source code so if anyone is so inclined, feel free to tweak!
If anyone uses this, let me know.
-Nick |
 |
|
| |
 Topic Topic  |
|

