| Author |
 Topic Topic  |
|
|
Simomax

United Kingdom
4 Posts |
 Posted - 10/11/2024 : 23:33:52 Posted - 10/11/2024 : 23:33:52


|
Hello!
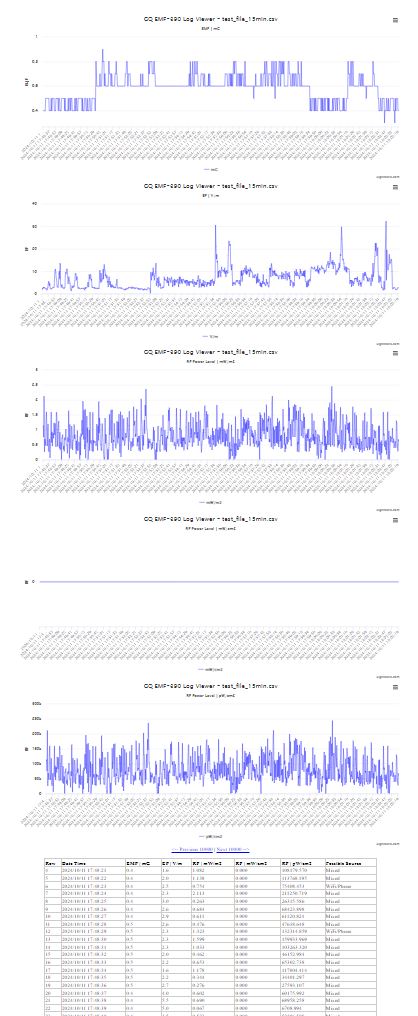
I wrote a web page for displaying the data log for the EMF-390 as it appears there is no software or other way of easily viewing the collected data. To use, simply upload your .csv and it will display the records in both graphs and a data table showing 10,000 records at a time. As it stands, the graphs will show the entire dataset and the data table will show 10,000 records. There are buttons to show the next/previous 10,000 records, but the graphs will always show the full dataset.
I have found it capable of loading/displaying the entire full memory (1048kb), but the larger the dataset, the slower it will be, so please allow a few seconds for it to display the data when uploading large .csv files. Most of the actual time taken is due to data being sent from my server to the browser and the time it takes for the client machine (my/your PC) to render it in the browser. Some old/slow PCs may struggle with viewing the full log file. In that case the log file should be edited into smaller chunks.
Some things to note:
If editing the log file into smaller chunks it is important to note that the first three lines of the .csv are ignored as they contain header text. That is the reason the rows start at 4.
The uploaded files are not automatically deleted yet and they will require me to manually delete them until I write in some mechanism to do this.
I only wrote this yesterday, so it is in it's infancy. My intention is to change the way it works in the future so it uploads the data to a MySQL database where the dataset can be drilled down into, and the graphs will also show the selected data, not the full dataset as it does currently. That is for another day though.
There is no SLA whatsoever with this, but I intend on keeping it online and available for anyone to use, for free, providing it is not abused. Any signs of abuse and I will take it down.
https://www.schmoozie.co.uk/gqemf390logviewer/
Have fun!
Simomax |
|
| Reply #1
hberg
4 Posts |
Posted - 11/17/2024 : 08:11:31
|
Nice, really useful for a quick analysis. A nice addon would be to toggle the y-axis to be logarithmic, then one would see smaller changes more easily.
Thanks for the website! |
 |
|
| Reply #2
Simomax
United Kingdom
4 Posts |
Posted - 11/21/2024 : 01:05:42
|
Thanks for your comment, hberg. That's a good idea, so I have made it so by adding a link to switch between logarithmic and linear. 
When uploading a file it will revert to linear chart (default) but you can use the link to switch between log and lin. The log/lin is a feature in the chart component itself and does seem to act a little strange by not rendering the 0's. I think that is beyond my control, but shouldn't be an issue.
Cheers, Simomax |
|
|
| Reply #3
lewis

10 Posts |
Posted - 07/25/2025 : 06:16:33
|
Hi, I tried uploading a CSV file I just downloaded from my device, but I encountered a few problems:
1) I think the web page is too large because 10,000 entries are too many to display on my browser. My mini-PC crashed and I had to restart it.
2) I think there are errors interpreting the fields... I see the date is wrong, and the values also seem incorrect.
If you'd like, I can send you the CSV, but it should theoretically already be on your server. |
|
|
| Reply #4
Simomax
United Kingdom
4 Posts |
Posted - 09/12/2025 : 23:12:08
|
Hi Lewis, I think I have found the data you uploaded, going by date. I'm not sure how you exported your data, but the formatting/columns are incorrect for what the page is trying to read. This is intended to use with the file that is generated when you download the data from your device, and is named something like 'emfhistory_06092025_183218.csv', I think the file you uploaded is '2025-07-25_14-49-05.csv' which doesn't bear the same file name format - not that the file name matters, but the data in the file is in an unexpected format.
The page is looking for data such as:
EMF-390 Data Logged History
,EMF,EF,RF Power Density
Date and Time,mG,V/m,mW/m2,mW/cm2,pW/cm2, Possible Source
2025/08/30 15:18:29,0.4,1.1,0.003,0.000,339.785,Mixed
2025/08/30 15:18:30,0.4,1.1,0.003,0.000,339.785,Mixed
2025/08/30 15:18:31,0.4,1.1,0.003,0.000,339.785,Mixed
However, the data you submitted is (first 4 lines):
1753445455,2025-07-25 12:10:55,0.9,2.5,1.3792623,0.00013792624,137926.23
1753445456,2025-07-25 12:10:56,0.9,2.3,0.7536658,0.00007536658,75366.58
1753445457,2025-07-25 12:10:57,0.9,2.1,0.4352229,0.00004352229,43522.29
1753445458,2025-07-25 12:10:58,16,1.9,1.1501123,0.00011501123,115011.23
As the parser is fixed on the columns your data is being shifted into the wrong columns. The first column in your data is unix (epoch) time - my page isn't designed for that column and isn't expecting it. So the issue is with the data you have uploaded to the page, not the page itself.
Also regarding it maxing out your mini PC - there is little I can do about that. You can either use a more powerful PC, or use a text editor to break the file down into smaller chunks. I have no issues displaying your file, even though the data is jumbled up, on my >11 year old gen 3 I7, so maybe use a more powerful machine, or break the data into smaller chunks. |
Edited by - Simomax on 09/12/2025 23:13:23 |
|
|
| |
Topic |
|
|
|