| T O P I C R E V I E W |
| ullix |
Posted - 07/13/2017 : 04:56:27
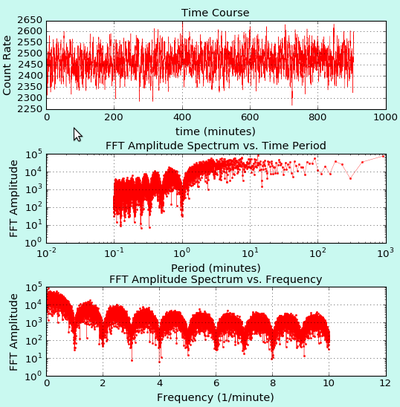
Looking at a typical CPM logging result (using a gas mantle as radioactive source) like shown in the top panel of the first figure, it seemed to me that there might be a periodic signal with a time period of 1..3 hours present. Which would have been strange.
The numeric library numpy, already in use in GeigerLog, makes it very easy to analyze frequency component in a signal using FFT (Fast Fourier Analysis). To my surprise the result, as seen in the middle panel, clearly showed no signal for periods of hours and longer.
However, it showed a pronounced dip at a period of exactly 1 minute.
Looking at the bottom panel, you can even see that the frequency 1/minute is present, and all its harmonics up to the 9th. (More cannot be seen as the sampling rate had been 3 sec, giving a cutoff at 6sec, or frequency of 10/min).
Image Insert:
146275 bytes
I am not sure what the reason is, but as I used CPM sampling, it may be an indication that the counter is busy in intervals of 1 minute, and misses a few counts - hence the depression, i.e. lack of counts, at 1 min in the Fourier spectra? Any other explanation?
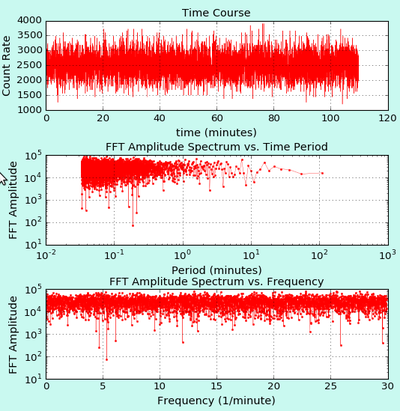
Made me wonder what a CPS recording would show, which is shown in the next figure. Clearly, the frequency spectrum in bottom panel is perfectly flat.
However, since I was sampling with 1 sec, the highest frequency visible, the Nyquist frequency, would be at period 2 sec (30/min) and hence any effect at 1 sec would not be visible in the spectra.
Image Insert:
138847 bytes |
| 8 L A T E S T R E P L I E S (Newest First) |
| ullix |
Posted - 07/18/2017 : 00:10:46
I actually use a 3 second cycle, which is why you can see up to the 10th harmonic (10/min = 1 per 6s, the fastest you can resolve with 3s sampling). Not much behind it except that it gives you a changing count at background level.
Background is 15-20CPM for most people, i.e. 1 count every 3 to 4 seconds. Of course, when you have stronger radioactive source your count rate changes faster, perhaps even within sub-second times.
In CPM mode you basically have a moving average over 1 minute with updates every second. Hence it would suffice to record with a cycle of 1 minute to get a complete picture. The history in the counter is made this way and quite appropriate. But when you sit in front of the computer you just want to see some changes ;-).
More reasoning with statistics detailed in my Potty Training https://sourceforge.net/projects/geigerlog/files/GeigerLog-Potty%20Training%20for%20Your%20Geiger%20Counter-v1.0.pdf/download
|
| Distelzombie |
Posted - 07/17/2017 : 08:18:11
But maybe detection/registering the impulse takes a while.
Why do you use 2sec interval anyway? My device gives different values (if something happened) every second.
... and now I'm wondering if the sentence in my signature is grammatically correct. |
| ullix |
Posted - 07/17/2017 : 01:05:25
Yes, the FFT is now in version 0.9.04 of GeigerLog.
Using the history will not reveal this pattern. Because you either use CPM and store values every 1 min - which is obviously too slow for a signal of 1 min - or you use CPS and store every second - which then does not give the effect.
You need to use logging. When sampling in the CPM mode all settings from every 1 second up to every 30 seconds gave the effect. The number of what I called "harmonics" changed accordingly.
Looking forward to your high rate data, but I guess it will look the same. Calculation takes about the same effort whether numbers are big or small.
With 10min total sampling you can resolve only up to 5min periods. @2sec sample time this gives only 300 samples. May be a bit on the low side, given the expected scatter. But you'll have to live with what you get; prefer one long run over several short ones.
|
| Distelzombie |
Posted - 07/16/2017 : 09:39:47
Ups I forgot about that picture.
Than it's interesting. :)
Can someone else please do the same analysis? I guess the FFT function is now in your program?
To see if it is every device. But I don't see why it should not.
Did you had your device connected to power/computer or is it data from the history? Although the CPS picture means it shouldn't be a thing from the recharge circuit.
My guess is the device is doing some calculations at the end of one minute, what in return uses too much CPU power to process all the clicks. However even that makes no sense, since my measurements in high radiation areas should have shown something in the normal graph then...
I'm going to do a measurement with 50-60k CPM in the next weekend. I'm curious what that would look like in FFT. I may try CPM over 100k just to see how that value fluctuates.
But I can't leave the device for hours there. Do you think a measurement of 15 min is enough to show that behavior? Maybe 10 or 30? |
| ullix |
Posted - 07/16/2017 : 06:24:30
For white noise see the 2nd image in this tread; it is picture perfect white noise.
If it were leakage, where would it leak from? There is nothing peaking from 1 minute to 16 hours to leak from.
I tried to simulate the result with some combination of sine, rectabgle, spike, white noise, sampling rates but always failed. No idea how to create the pattern seen in the first image. |
| Distelzombie |
Posted - 07/15/2017 : 09:17:32
They look too much like that spectral leakage to me. It's so characteristic. The term is explained in the Wikipedia article I linked. (In context)
Can you do other tests to verify this? Maybe generate some real white noise and let your FFT code go through that. |
| ullix |
Posted - 07/15/2017 : 01:14:44
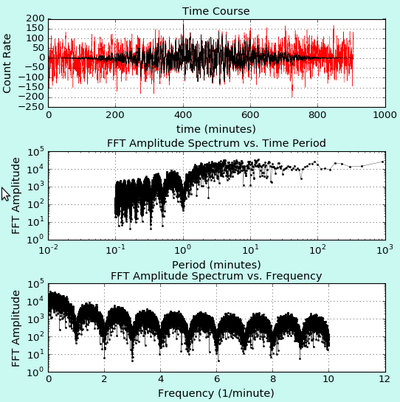
I do know about window functions, and I applied Hanning, Hamming, Blackman and Kaiser functions, the latter with a range of parameters. They all deliver about the same result, as shown in the figure for a Kaiser with parameter for a Blackman-like window.
Exact same data as in the first figure, except that the average had been subtracted to avoid low frequency distortions due to the windowing function. (Original data in red, windowed data in black).
Those dips at f=1/min and harmonics are real and present in the actual data. They have nothing to do with any "spectral leakage", whatever this is supposed to mean. Any window, be it rectangular or other, does not create them.
Image Insert:
144854 bytes |
| Distelzombie |
Posted - 07/14/2017 : 02:34:24
I'm not sure if you know about FFT window functions. It looks like you used a rectangular function. That's good for determining a certain frequency, but it will show those anomalies shown in the first picture. (spectral leakage) Those are not present in the actual frequency spectrum! They are created by the rectangular window function.
You should probably use Kaiser with 4.0 multiple or Blackman Harris.
https://en.m.wikipedia.org/wiki/Window_function
|
|
|